11. Cheatsheets
11.1. WCS
The OGC Web Coverage Service (WCS) standard defines support for modeling and retrieval of geospatial data as coverages (e.g. sensor, image, or statistics data).
WCS consists of a Core specification for basic operation support with regards to coverage discovery and retreival, and various Extension specifications for optional capabilities that a service could provide on offered coverage objects.
11.1.1. Core
The Core specification is agnostic of implementation details, hence, access syntax and mechanics are defined by protocol extensions: KVP/GET, XML/POST, and XML/SOAP. Rasdaman supports all three, but further on the examples are in KVP/GET exclusively, as it is the most straightforward way for constructing requests by appending a standard query string to the service endpoint URL. Commonly, for all operations the KVP/GET request will look as follows:
http(s)://<endpoint url>?service=WCS
                        &version=2.0.1
                        &request=<operation>
                        &...
Three fundamental operations are defined by the Core:
GetCapabilities - returns overal service information and a list of available coverages; the request looks generally as above, with the <operation> being GetCapabilities:
http(s)://<endpoint url>?service=WCS&version=2.0.1&request=GetCapabilities
Example:
DescribeCoverage - detailed description of a specific coverage:
http(s)://<endpoint url>?service=WCS&version=2.0.1&request=DescribeCoverage
                        &coverageId=<coverage id>
Example:
GetCoverage - retreive a whole coverage, or arbitrarily restricted on any of its axes whether by new lower/upper bounds (trimming) or at a single index (slicing):
http(s)://<endpoint url>?service=WCS&version=2.0.1&request=GetCoverage
                        &coverageId=<coverage id>
        [optional]      &subset=<axis>(<lower>,<upper>)
        [optional]      &subset=<axis>(<index>)
        [optional]      &format=<mime type>
Example:
11.1.2. Updating
The Transaction extension (WCS-T) specifies the following operations for constructing, maintenance, and removal of coverages on a server: InsertCoverage, UpdateCoverage, and DeleteCoverage.
Rasdaman provides the wcst_import tool to simplify the import of data into analysis-ready coverages (aka datacubes) by generating WCS-T requests as instructed by a simple configuration file.
11.1.3. Processing
The Processing extension enables advanced analytics on coverages through WCPS queries. The request format is as follows:
http(s)://<endpoint url>?service=WCS&version=2.0.1&request=ProcessCoverages
                        &query=<wcps query>
e.g. calculate the average on the subset from the previous GetCoverage example:
Note that the query part (following the &query= parameter in the URL) needs
to be URL-encoded because it may contain characters that are not allowed in URLs.
This can be done online, e.g. with this URLEncoder,
or one can use a tool such as curl that does it automatically:
curl 'https://ows.rasdaman.org/rasdaman/ows?service=WCS&version=2.0.1&request=ProcessCoverages' \
     -d 'query=for $c in (AvgLandTemp) return avg($c[Lon(-90.0:85.3), ansi("2014-10-01")])'
11.1.4. Range subsetting
The cell values of some coverages consist of multiple components (also known as ranges, bands, channels, fields, attributes). The Range subsetting extension specifies the extraction and/or recombination in possibly different order of one or more bands. This is done by listing the wanted bands or band intervals; e.g AverageChlorophyllScaled has Blue, Green, and Red bands and the following recombines them into a Red, Green, Blue order:
11.1.5. Scaling
Scaling up or down is a common operation supported by the Scaling extension. An additional GetCoverage parameter indicates the scale factor in several possible ways: as a single number applying to all axes, multiple numbers applying to individual axes, full target scale domain, or per-axis target scale domains. E.g. a single factor to downscale all axes by 4x:
Currently only nearest neighbour interpolation is supported for scaling.
11.1.6. Reprojection
The CRS extension allows to
reproject a coverage before retreiving it. For example AverageChlorophyllScaled
has native CRS EPSG:4326, and the following request will return the result in
EPSG:3857:
http://ows.rasdaman.org/rasdaman/ows?service=WCS&version=2.0.1&request=GetCoverage&coverageId=AverageChlorophyllScaled&format=image/png&subset=unix(“2015-01-01”)&outputCrs=http://ows.rasdaman.org/def/crs/EPSG/0/3857
or change the CRS in which subset or scale coordinates are specified:
The CRS in subsettingCrs / outputCrs can be specified in these notations.
11.1.7. Interpolation
Reprojection (optionally with subsequent scaling) can be performed with various interpolation methods as enabled by the Interpolation extension:
Rasdaman supports several interpolation methods as documented here.
11.2. WCPS
The OGC Web Coverage Processing Service (WCPS) standard defines a protocol-independent declarative query language for the extraction, processing, and analysis of multi-dimensional coverages representing sensor, image, or statistics data.
The overall execution model of WCPS queries is similar to XQuery FLOWR:
for $covIter1 in (covName, ...),
    $covIter2 in (covName, ...),
    ...
let $aliasVar1 := covExpr,
    $aliasVar2 := covExpr,
    ...
where booleanExpr
return processingExpr
Any coverage listed in the WCS GetCapabilities response can be used in place
of covName. Multiple $covIter essentially translate to nested loops.
For each iteration, the return clause is evaluated if the result of the
where clause is true. Coverage iterators and alias variables can be
freely used in where / return expressions.
Conforming WCPS queries can be submitted to rasdaman as WCS ProcessCoverages requests, e.g:
http://localhost:8080/rasdaman/ows?service=WCS&version=2.0.1
    &request=ProcessCoverages
    &query=for $covIter in (covName) ...
The WSClient deployed with every rasdaman installation provides a convenient console for interactively writing and executing WCPS queries: open http://localhost:8080/rasdaman/ows in your Web browser and proceed to the ProcessCoverages tab.
Operations can be categorized by the type of data they result in: scalar, coverage, or metadata.
11.2.1. Scalar operations
Standard operations applied on scalar operands return scalar results:
Operation category
Operations
Arithmetic
+ - * / abs round mod floor ceilExponential
exp log ln pow sqrtTrigonometric
sin cos tan sinh cosh tanharcsin arccos arctan atan2 arctan2Comparison
> < >= <= = != min maxLogical
and or xor not bit overlaySelect field from multiband value
.Create multiband value
{ bandName: value; ..., bandName: value }Type casting
(baseType) valuewhere baseType is one of: boolean,[unsigned] char / short / int / long,float, double, complex, complex2
Aggregation operations summarize coverages into a scalar value.
Aggregation type
Function / Expression
Of numeric coverages
avg,add(or aliassum),min,maxOf boolean coverages
countnumber of true values;some/all= true if some/all values are trueGeneral condenser
condenseopover$iterVar axis(lo:hi), …[whereboolScalarExpr ]usingscalarExprThe general condenser aggregates values across an iteration domain with a condenser operation op (one of
+,*,max,min,and, oror). For each coordinate in the iteration domain defined by theoverclause, the scalar expression in theusingclause is evaluated and added to the final aggregated result; the optionalwhereclause allows to filter values from the aggregation.
11.2.2. Coverage operations
Standard operations applied on coverage (or mixed coverage and scalar) operands return coverage results. The operation is applied pair-wise on each cell from the coverage operands, or on the scalars and each cell from the coverage in case some of the operands are scalars. All coverage operands must have matching domains and CRS.
Subsetting allows to select a part of a coverage (or crop it to a smaller domain):
covExpr[ axis1(lo:hi), axis2(slice), axis3:"crs"(...), ... ]
axis1in the result is reduced to span from coordinatelotohi. Either or bothloandhican be indicated as*, corresponding to the minimum or maximum bound of that axis.axis2is restricted to the exact slice coordinate and removed from the result.axis3is subsetted in coordinates specified in the givencrs; the CRS must be specified in one of these formats. By default coordinates must be given in the native CRS ofC.
Extend is similar to subsetting but can be used to enlarge a coverage with null values as well, i.e. lo and hi can extend beyond the min/max bounds of a particular axis; only trimming is possible:
extend( covExpr, { axis1(lo:hi), axis2:crs(lo:hi), ... } )Scale is like extend but it resamples the current coverage values to:
Fit a new grid domain:
scale( covExpr, { axis1(lo:hi), axis2:"CRS:1"(lo:hi), ... } )Note that
axis1in this case should have a grid native CRS, such as Index1D, whileaxis2may be any type of axis; in all casesloandhishould be grid integer bounds.Fit the domain of another coverage:
scale( covExpr, { imageCrsDomain( $anotherCoverage ) } )Scale by a factor (factor > 1 for scaling up, 0 < factor < 1 for scaling down):
scale( covExpr, number )
Scale by custom factor per axis:
scale( covExprs, { axi1(factor1), axis2(factor2), ... } )
Non-spatial axes which are omitted in the first and last variants will not be scaled (details here <wcps-optional-non-scaled-axes>). If only one spatial axis is specified, then the other spatial axis will be resampled so that the original ratio is preserved(more details here <wcps-auto-ratio-scaling>). Currently only nearest neighbour interpolation is supported for scaling.
Reproject to a different CRS can be done with
crsTransform:crsTransform( covExpr, { axisX:outputCRS, axisY:outputCRS } [ , { interpolation } ] [ , { axisLabelX:geoXRes, axisLabelY:geoYRes } ] [ , { axisLabelX(lo:hi), axisLabelY(lo:hi)} | { domain(2Dcoverage) } ] )where the
outputCrscan be specified in these formats.For example, the query below reprojects a 2D coverage to
EPSG:4326CRS withbilinearinterpolation, target geo resolutions forLatandLonaxes0.5and1 + the resolution of Lat axis in coverage $drespectively, and crops the result to the target geo domain[Lat(30.5:60.5), Lon(50.5:70.5)]:crsTransform($c, { Lat:"http://localhost:8080/rasdaman/def/crs/EPSG/0/4326", Lon:"http://localhost:8080/rasdaman/def/crs/EPSG/0/4326" }, { bilinear }, { Lat:0.5, Lon:1 + domain($d, Lat).resolution }, { Lat(30.5:60.5), Lon(50.5:70.5) } )
Alternatively, a shorthand version can be used where the target CRS is applied to both axes (instead of specifying it individually for each axis). A similar example as above but with shorthand CRS notation and target geo domain that matches the domain of coverage
$d:crsTransform($c, "EPSG:4326", { bilinear }, { Lat:0.5, Lon:1 + domain($d, Lat).resolution }, { domain($d) } )For supported interpolation methods see the options for resampleAlg parameter.
Conditional evaluation is possible with the
switchstatement:switch case boolCovExpr return covExpr case boolCovExpr return covExpr ... default return covExpr
General coverage constructor allows to create a coverage given a domain, where for each coordinate in the domain the value is dynamically calculated from a value expression which potentially references the iterator variables:
coverage covName
over $iterVar axis(lo:hi), ...
values scalarExpr
Typically the iterator variable is iterated through a grid domain, e.g. by using the
imageCrsdomain(coverageExpr, axisLabel)operator. However, iteration over a geo domain is also supported withdomain(coverageExpr, axisLabel). Note that this feature is a non-standard extension that rasdaman provides for convenience. For example, to create a 2D geo-referenced coverage withLatandLonaxes, based on an existing geo-referenced coverage:for $c in (test_mean_summer_airtemp) return encode( coverage targetCoverage over $pLat Lat(domain($c[Lat(-30:-28.5)], Lat)), $pLon Lon(domain($c[Lon(111.975:113.475)], Lon)) values $c[Lat($pLat), Lon($pLon)] , "tiff")
General condenser on coverages is same as the scalar general condenser, except that in the
usingclause we have a coverage expression. The coverage values produced in each iteration are cell-wise aggregated into a single result coverage.condense op over $iterVar axis(lo:hi), ... [ where boolScalarExpr ] values covExpr
Constant coverage allows to create a coverage given a domain, where literal scalar constants for each coordinate in the domain are listed in place (semicolon-separated). [RE] Besides constant values, also general scalar expressions are allowed, e.g.
avg($c).Example:
coverage covName
over $iterVar axis(lo:hi), ...
value list <0;1>
Encode allows to export coverages in a specified data format, e.g:
encode(covExpr, "image/jpeg")
WCPS supports
application/gml+xmlcorresponding to an OGC WCSGetCoveragerequest. Many further formats are supported, see here for details.
Band names and metadata are reset after operations which change the pixel values, e.g.
pow($c, 2)or$c.red + $d.red. Instead of following WCPS standard to copy band information from the first coverage expression in the result, petascope resets the band names tobandIndex(Indexranges from1to the total number of bands). Bands metadata is stripped completely and set to the default unit of measurement code of10^0.The following operations do not reset band names and metadata:
.band,cast,clip,extend,scale,subset,crsTransform,sort,flip,polygonize,not,ceil,floor,round.Example with a 3-bands (
red,green,blue) coverage with band extraction afterpow()operation:for $c in (test_cov) return encode( pow($c, 2).band1, "image/png" )
11.2.3. Atomic types
The set of atomic types for Coverage range field data types according to OGC WCPS standard. See rasdaman atomic types for comparison.
type name |
size |
description |
|---|---|---|
|
1 bit |
true (nonzero value), false (zero value) |
|
8 bit |
signed integer |
|
8 bit |
unsigned integer |
|
16 bit |
signed integer |
|
16 bit |
unsigned integer |
|
32 bit |
signed integer |
|
32 bit |
unsigned integer |
|
32 bit |
single precision floating point |
|
64 bit |
double precision floating point |
|
32 bit |
complex of 16 bit signed integers |
|
64 bit |
complex of 32 bit signed integers |
|
64 bit |
single precision floating point complex |
|
128 bit |
double precision floating point complex |
11.2.3.1. Literal Type Suffixes
Literal number values can be explicitly typed with a suffix, as described in
the table below.
By default, without a suffix, integer values are of type int,
while floating-point values are of type double.
WCPS suffix |
WCPS type |
rasql suffix |
rasql type |
example |
|---|---|---|---|---|
c |
char |
o |
octet |
-3c |
uc |
unsigned char |
c |
char |
255uc |
s |
short |
s |
short |
-2000s |
us |
unsigned short |
us |
unsigned short |
1000us |
l or none |
int |
l or none |
long |
13l == 13 |
ul |
unsigned int |
ul |
unsigned long |
393ul |
f |
float |
f |
float |
0.5f |
d or none |
double |
d or none |
double |
12.3d == 12.3 |
11.2.4. Metadata operations
Several functions allow to extract metadata information about a coverage C:
Metadata function |
Result |
|---|---|
imageCrsDomain(C, a) |
Grid (lo, hi) bounds for axis a |
imageCrsDomain(C, a).x |
Where x is one of |
domain(C, a, c) |
Geo (lo, hi) bounds for axis a in CRS c returning the lower and upper bounds respectively |
domain(C, a, c).x |
Where x is one of |
domain(C, a) |
Geo (lo, hi) bounds for axis a returning the lower and upper bounds respectively |
domain(C, a).x |
Where x is one of |
domain(C) |
List of comma-separated axes and their bounds according to coverage’s CRS orders respectively. Each list element contains an axis a with the lower and upper bounds in the axis CRS |
crsSet(C) |
Set of CRS identifiers |
imageCrs(C) |
Return the grid CRS (CRS:1) |
nullSet(C) |
Set of null values |
cellCount(C) |
Total number of grid pixels |
11.3. WMS
The OGC Web Map Service (WMS) standard defines map portrayal on geo-spatial data. In rasdaman, a WMS service can be enabled on any coverage, including 3-D or higher dimensional; the latest 1.3.0 version is supported.
rasdaman supports two operations: GetCapabilities, GetMap from the standard. We will not go into the details, as users do not normally hand-write WMS requests, but let a client tool or library generate them instead. Check the Clients section for some examples.
11.4. Clients
11.4.1. Rasdaman WSClient
WSClient is a web-client application to interact with WCS (version 2.0.1)
and WMS (version 1.3.0) compliant servers. Once rasdaman is installed it is
usually accessible at http://localhost:8080/rasdaman/ows; a publicly
accessible example is available at http://ows.rasdaman.org/rasdaman/ows. The
client has three main tabs: OGC Web Coverage Service (WCS), OGC Web Map
Service (WMS) and Admin. Further on, the functionality in each tab is
described in details.
11.4.1.1. WCS
There are sub-tabs for each of OGC WCS standard requests: GetCapabilities, DescribeCoverage, GetCoverage, ProcessCoverages.
GetCapabilities
This is the default tab when accessing the WSClient. It lists all coverages
available at the specified WCS endpoint. Clicking on the Get Capabilities
button will reload the coverages list. One can also search a coverage by typing
the first characters of its name in the text box. Clicking on a coverage name
will move to DescribeCoverage tab to view its metadata.
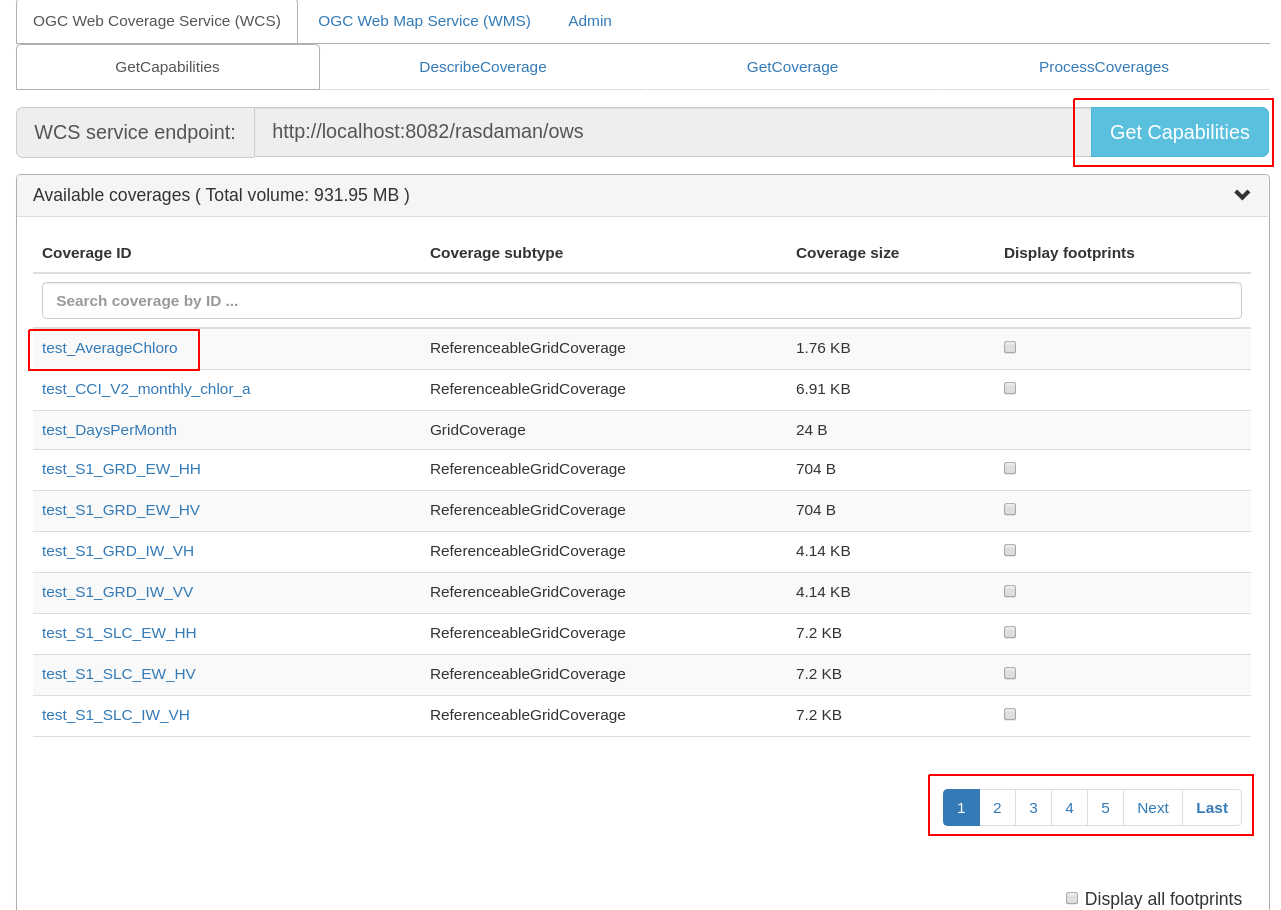
Figure 11.1 List of coverages shown on the GetCapabilities tab.
If a coverage is geo-referenced, a checkbox will be visible in the Display
footprints column, allowing to view the coverage’s geo bounding box (in
EPSG:4326) on the globe below.
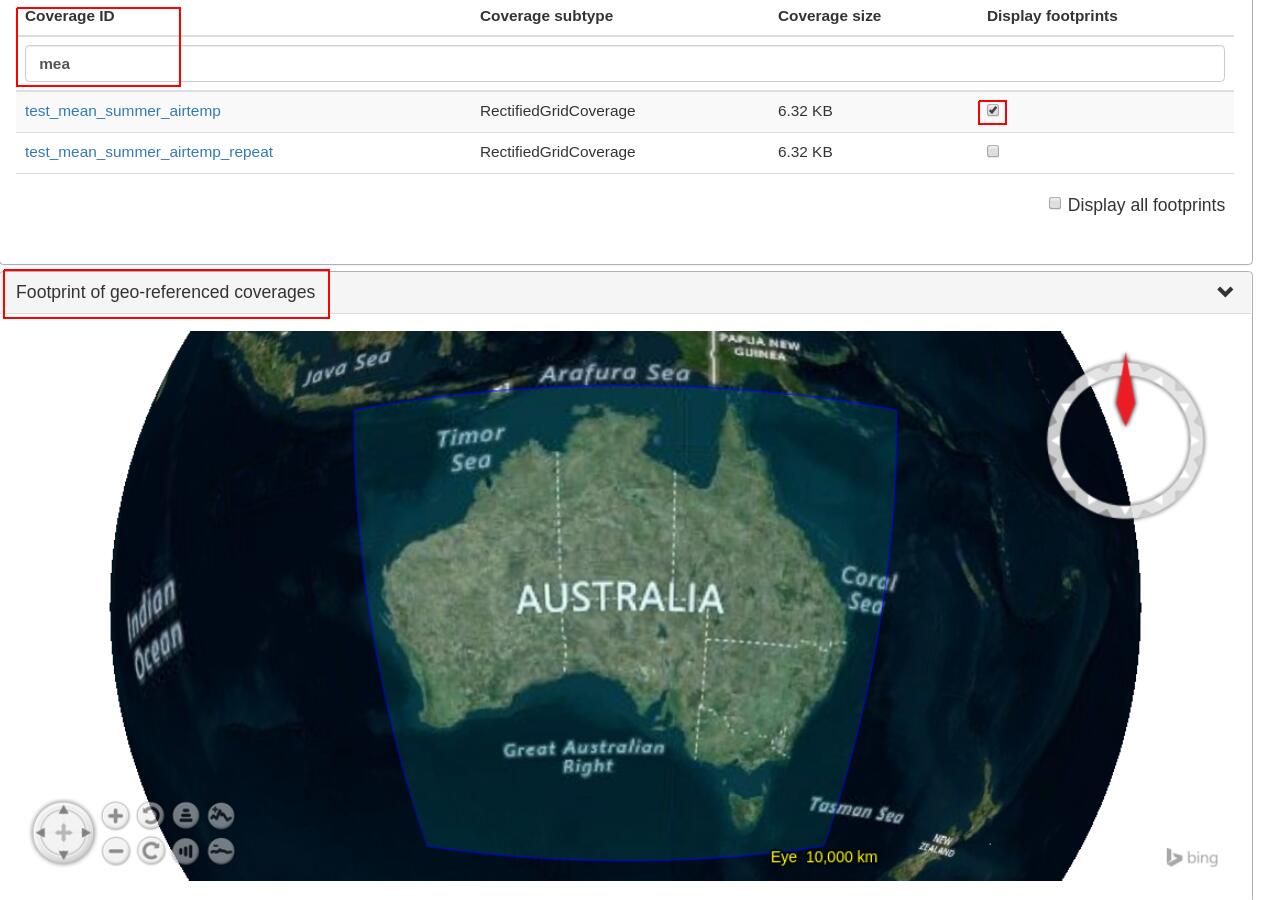
Figure 11.2 Selected coverage footprints shown on a globe.
At the bottom the metadata of the OGC WCS service endpoint are shown. These
metadata can be changed in the Admin -> OWS Metadata Management tab. Once
updated in the admin tab, click on Get Capabilities button to see the new
metadata.
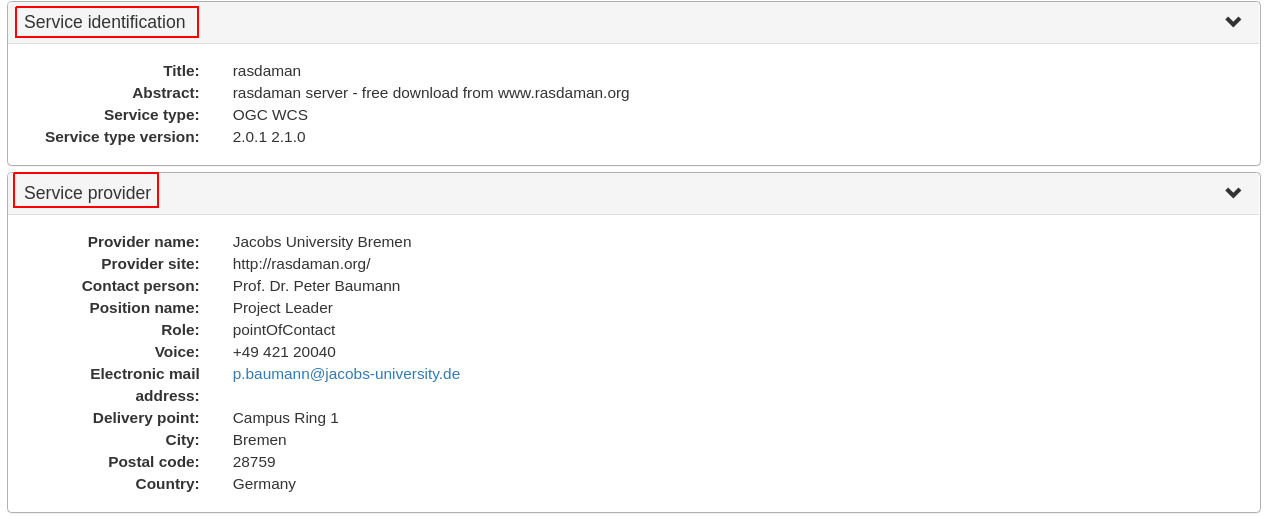
Figure 11.3 WCS service metadata.
DescribeCoverage
Here the full description of a selected coverage can be seen. One can type the
first few characters to search for a coverage id and click on Describe
Coverage button to view its OGC WCS metadata.
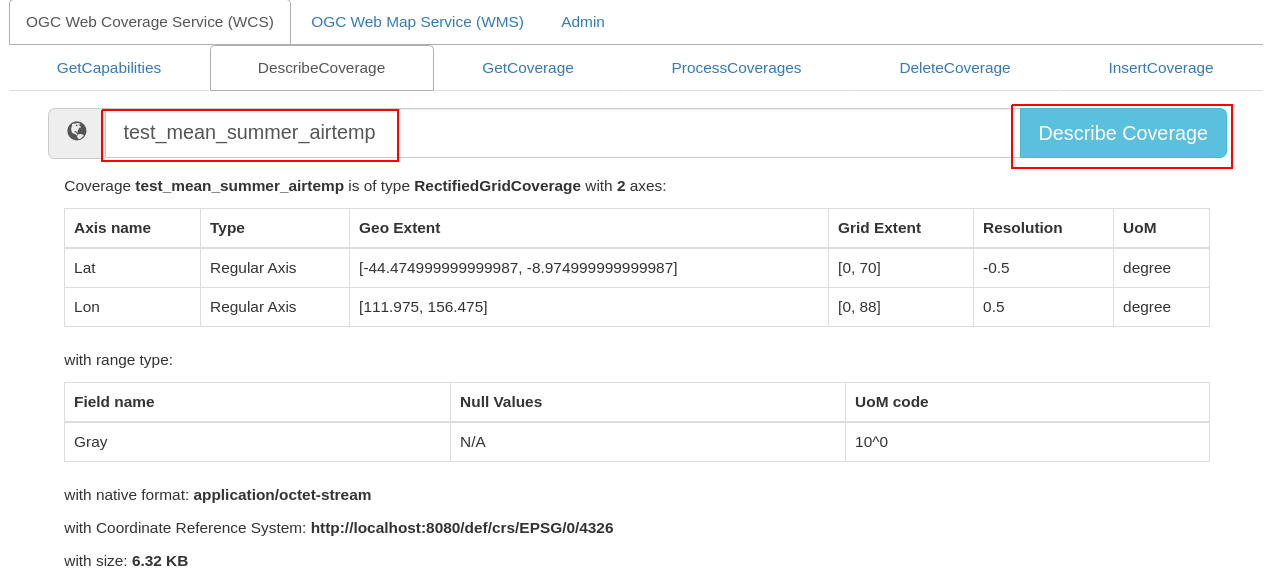
Figure 11.4 Showing full description of a coverage.
Once logged in as admin, it’s possible to replace the metadata with one from a valid XML or JSON file.
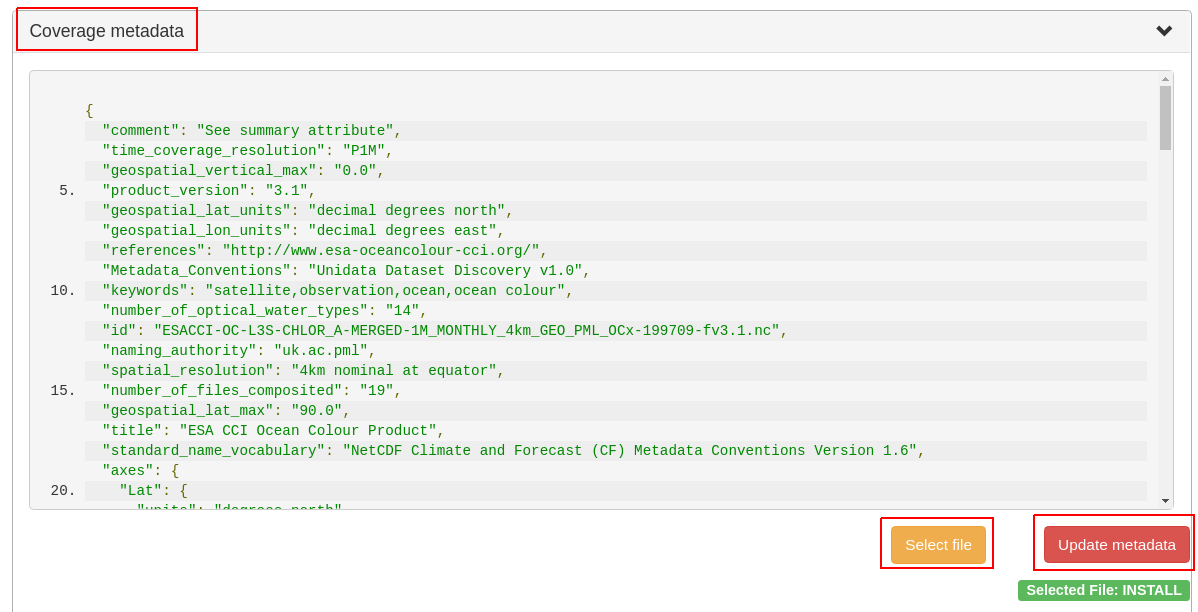
Figure 11.5 Updating the metadata of a coverage.
GetCoverage
Downloading coverage data can be done on this tab (or the next one,
ProcessCoverages). It’s similiarly possible search for a coverage id in the text
box and click on Select Coverage button to view its boundaries. Depending on
the coverage dimension, one can do trim or slice subsets on the corresponding
axes to select an area of interest. The output format can be selected (provided
it supports the output dimension). Finally, clicking on Get Coverage button
will download the coverage.
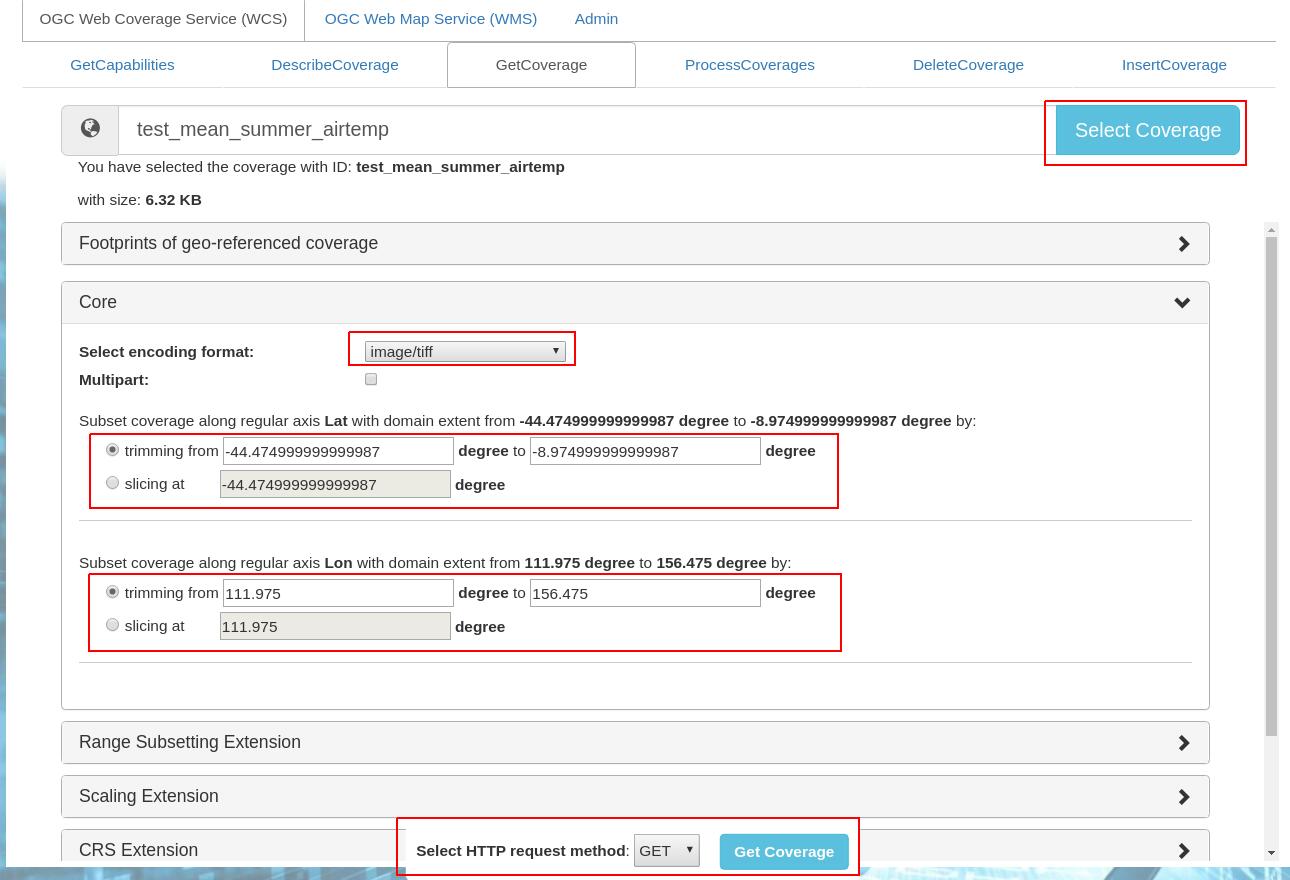
Figure 11.6 Downloading a subset of a coverage, encoded in image/tiff.
In addition, further parameters can be specified as supported by the WCS extensions, e.g. scaling factor, output CRS, subset of ranges (bands), etc.
ProcessCoverages
WCPS queries can be typed in a text box. Once Excute is clicked, the result
will be
displayed on the output console if it’s a scalar or the query was prefixed with
image>>(for 2D png/jpeg) ordiagram>>for (1D csv/json);otherwise it will be downloaded.
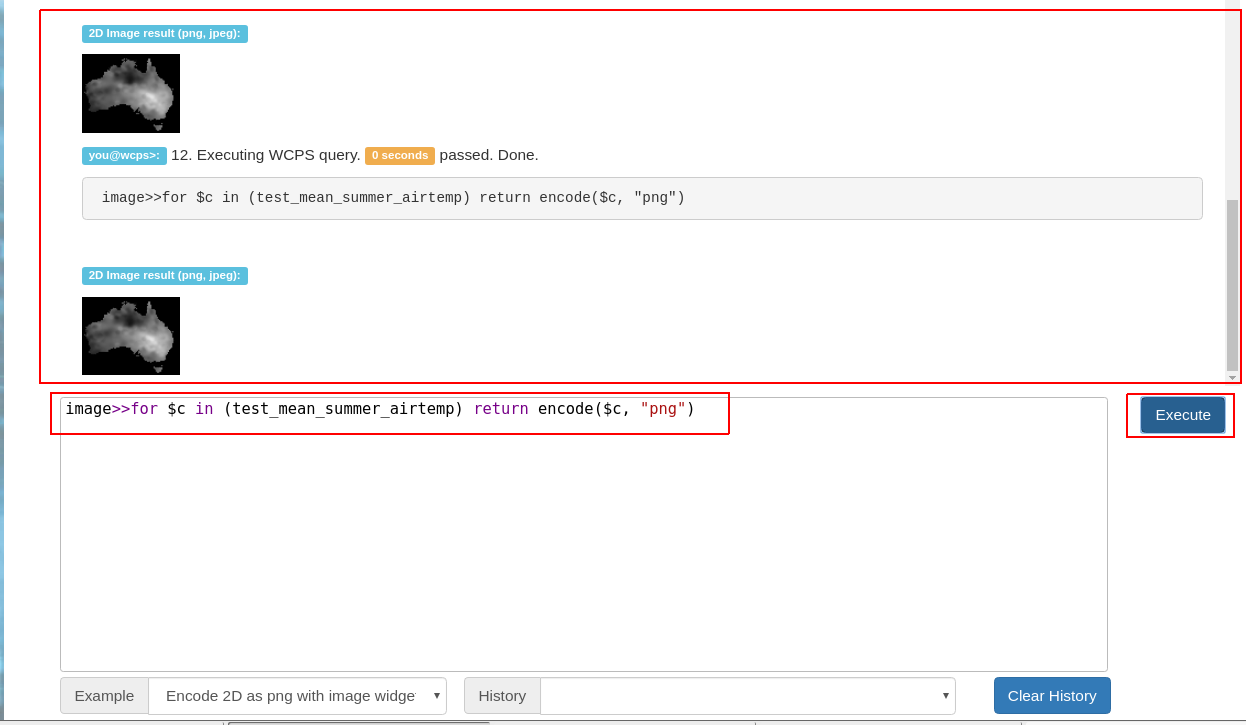
Figure 11.7 Query and output areas on the ProcessCoverages tab.
DeleteCoverage
This tab allows to delete a specific coverage from the server. It is only
visible when logged in the Admin tab.
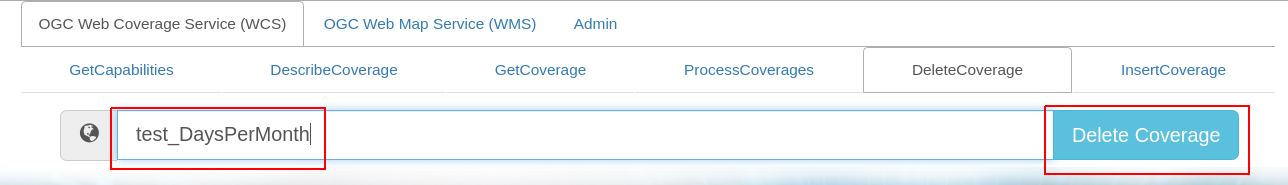
Figure 11.8 Deleting coverage test_DaysPerMonth.
InsertCoverage
Similarly, this tab is only visible when logged in the Admin tab. To insert
a coverage, a URL pointing to a valid coverage definition according to the WCS-T
standard needs to be provided. Clicking on Insert Coverage button will
invoke the correct WCS-T request on the server.
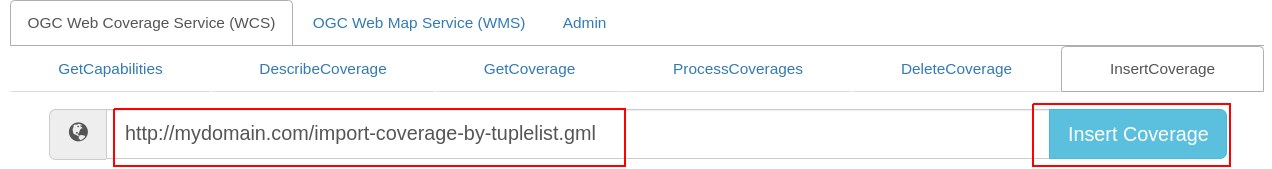
Figure 11.9 Inserting a coverage given a URL pointing to a valid GML document.
11.4.1.2. WMS
This tab contain sub-tabs which are related to the supported OGC WMS requests.
GetCapabilities
This tab lists the available layers on the specified server. To reload the list,
click on the Get Capabilities button. Clicking on a layer name will move to
DescribeLayer tab to view its description.
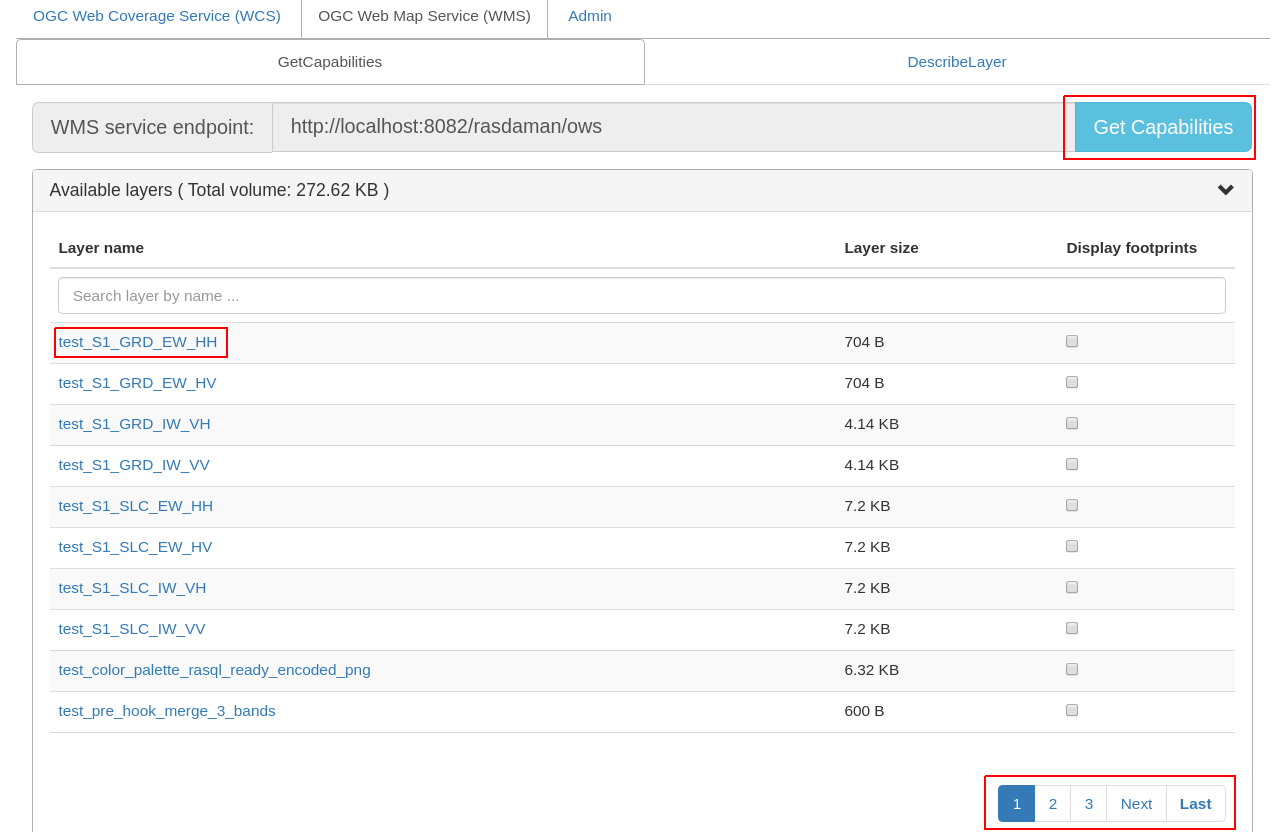
Figure 11.10 List of layers shown on the GetCapabilities tab.
Similar to the WCS GetCapabilities tab, it’s possible to search for layer names, or show their footprints.
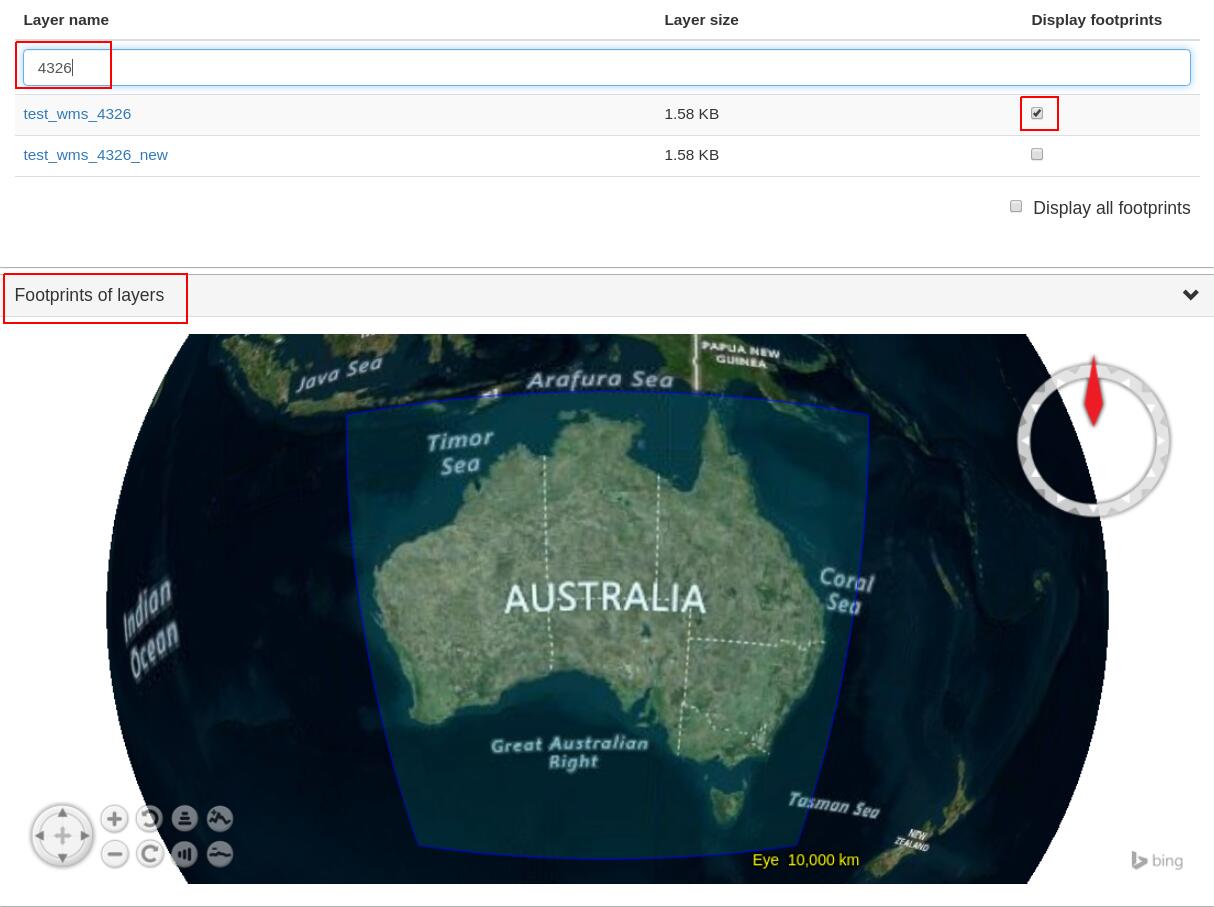
Figure 11.11 Selected layer footprints shown on a globe.
DescribeLayer
Here the full description of a selected layer is shown. One can type the first
few characters to search for a layer name and click on Describe Layer button
to view its OGC WMS metadata.
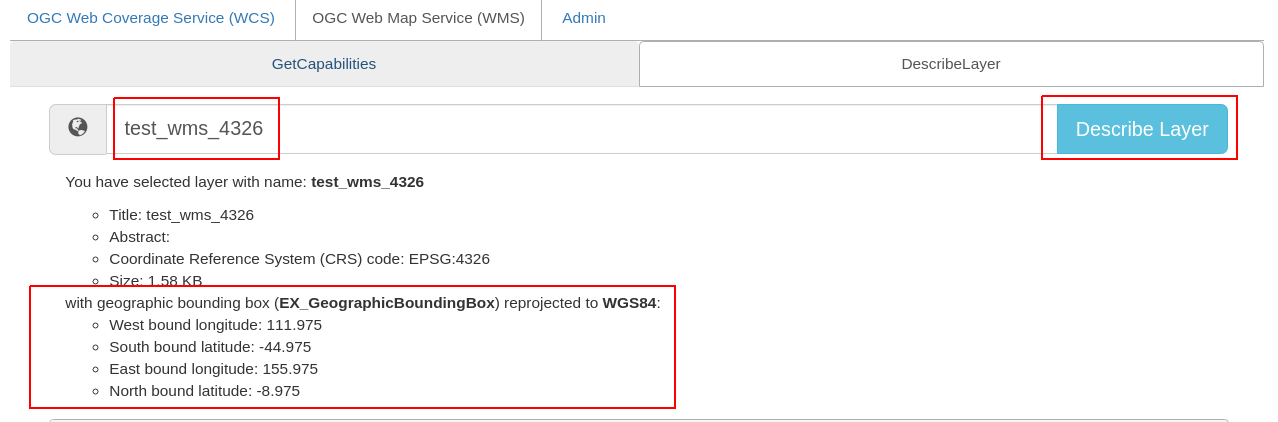
Figure 11.12 Showing full description of a layer.
Depending on layer’s dimension, one can click on show layer button and
interact with axes’ sliders to view a layer’s slice on the globe below. Click on
the hide layer button to hide the displayed layer on the globe.
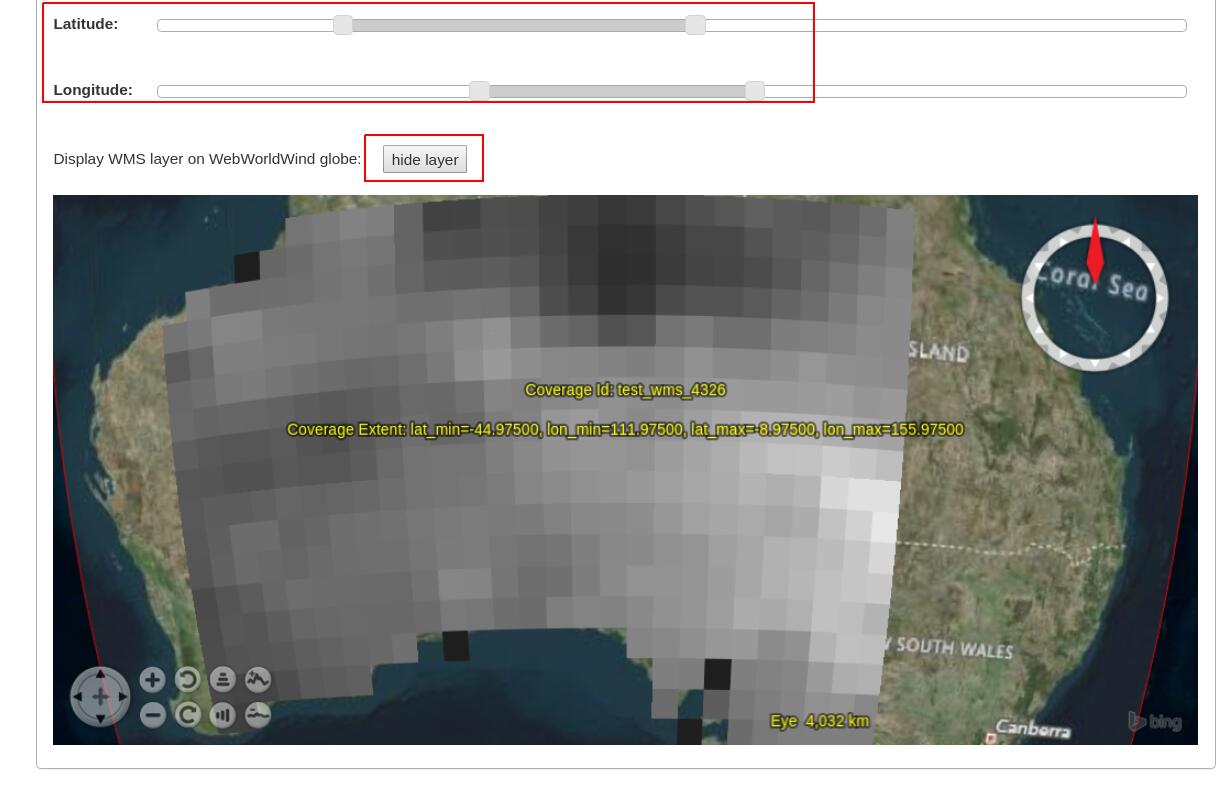
Figure 11.13 Showing/hiding a layer on the map.
Once logged in as admin, managing WMS styles is possible on this tab.
To create a style, it is required to input various parameters along with
a rasql or WCPS query fragment, which are applied on every GetMap request
if the style is active. Afterwards, click on Insert Style to insert
a new style or Update Style to update an existing style of the current
selected layer. One can also delete an existing style by clicking on
the Delete button corresponding to a style name.
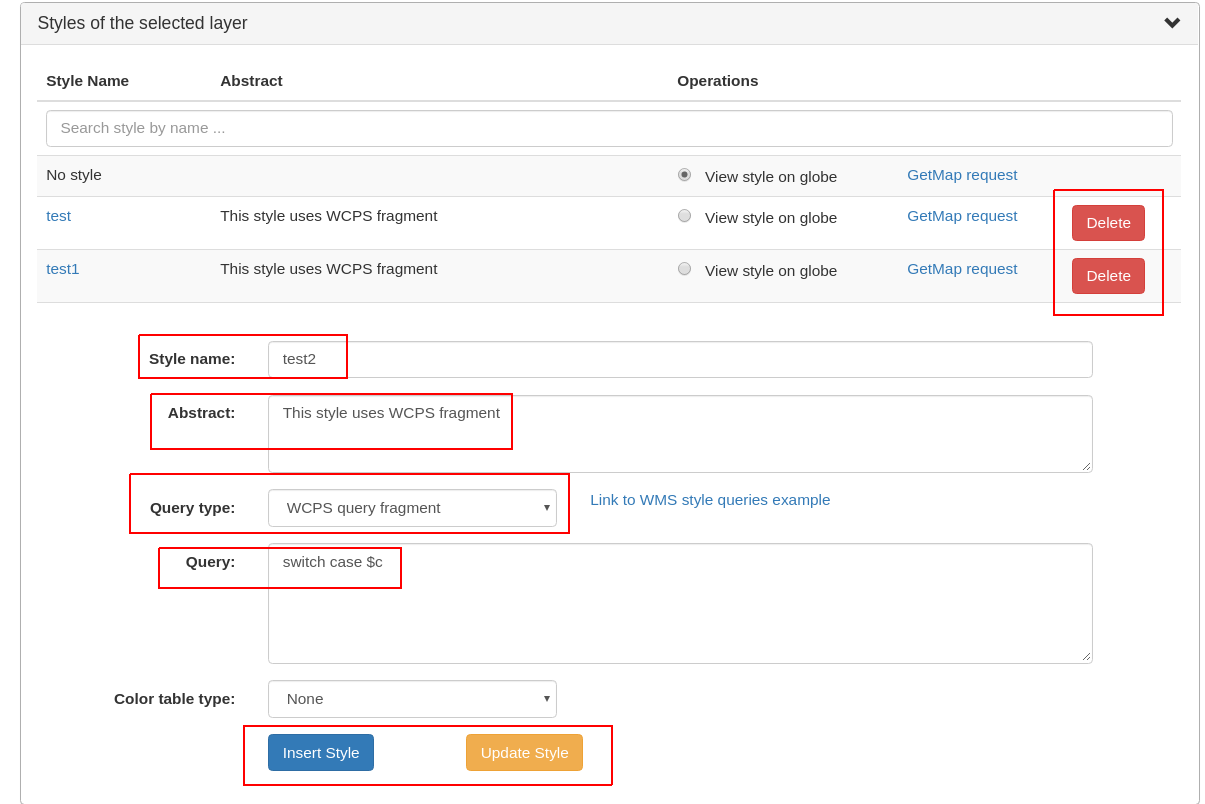
Figure 11.14 Style management on the DescribeLayer tab.
Finally, once logged in as admin, managing downscaled collection levels
of a WMS layer is also possible on this tab. To create a new level,
it is required to input level parameter (positive number). Afterwards,
click on Insert Level to insert a new downscaled collection level
of the current selected layer. One can also delete an existing level
by clicking on the Delete button corresponding to a downscaled
collection level.
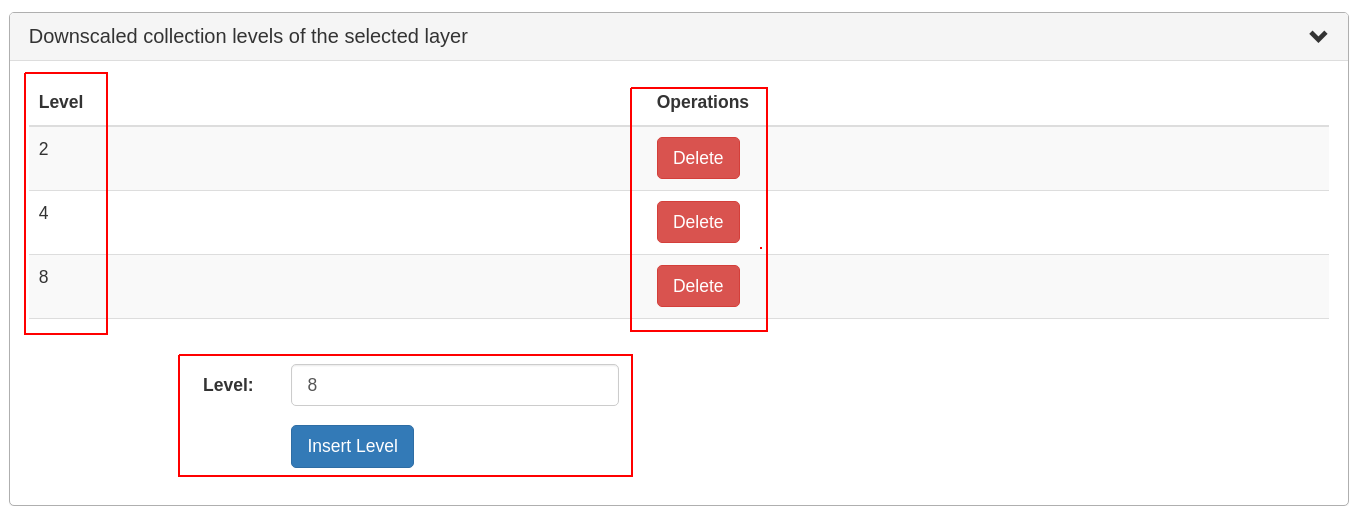
Figure 11.15 Downscaled collection level management on the DescribeLayer tab.
11.4.2. NASA WebWorldWind
Simple example to setup a web page with a map from a WMS server using WebWorldWind:
<html>
  <head>
    <script src="https://files.worldwind.arc.nasa.gov/artifactory/web/0.9.0/worldwind.min.js"></script>
    <script>
      document.addEventListener("DOMContentLoaded", function(event) {
        WorldWind.Logger.setLoggingLevel(WorldWind.Logger.LEVEL_WARNING);
        var wwd = new WorldWind.WorldWindow("canvasOne");
        var layers = [{
          layer: new WorldWind.BingRoadsLayer(null),
          enabled: true
        }, {
          layer: new WorldWind.CoordinatesDisplayLayer(wwd),
          enabled: true
        }, {
          layer: new WorldWind.ViewControlsLayer(wwd),
          enabled: true
        }];

        for (var l = 0; l < layers.length; l++) {
          wwd.addLayer(layers[l].layer);
        }

        var layerNamesToRequest = ["AvgTemperatureColorScaled"];
        var config = {
          title: "AvgTemperatureColorScaled", version: "1.3.0",
          service: "http://ows.rasdaman.org/rasdaman/ows",
          layerNames: layerNamesToRequest,
          // min Lat, max Lat, min Long, max Long of the requesting layer
          sector: new WorldWind.Sector(-90, 90, -180, 180),
          levelZeroDelta: new WorldWind.Location(36, 36),
          numLevels: 15, format: "image/png", styleNames: "", size: 256
        };

        var wmsLayer = new WorldWind.WmsLayer(config);
        wmsLayer.enabled = true;
        wwd.addLayer(wmsLayer);
      });
    </script>
  </head>
  <body>
      <canvas id="canvasOne" style="width: 100%; height: 100%;"> </canvas>
  </body>
</html>
Simple example to setup a web page with a map from a WMTS server using WebWorldWind:
<html>

  <head>
    <script src="https://files.worldwind.arc.nasa.gov/artifactory/web/0.9.0/worldwind.min.js"></script>
    <script src="https://ajax.googleapis.com/ajax/libs/jquery/2.1.3/jquery.min.js" type="text/javascript"></script>
  </head>

  <body>
    <canvas id="canvasOne" style="width: 100%; height: 100%;"> </canvas>

    <script>
      var wwd = new WorldWind.WorldWindow("canvasOne");
      document.addEventListener("DOMContentLoaded", function(event) {
        WorldWind.Logger.setLoggingLevel(WorldWind.Logger.LEVEL_WARNING);
        var layers = [{
          layer: new WorldWind.BingRoadsLayer(null),
          enabled: true
        }, {
          layer: new WorldWind.CoordinatesDisplayLayer(wwd),
          enabled: true
        }, {
          layer: new WorldWind.ViewControlsLayer(wwd),
          enabled: true
        }];

        for (var l = 0; l < layers.length; l++) {
          wwd.addLayer(layers[l].layer);
        }

      });

      // Web Map Tiling Service information from
      var serviceAddress = "http://localhost:8080/rasdaman/ows?service=WMTS&version=1.0.0&request=GetCapabilities";
      // Layer displaying Gridded Population of the World density forecast
      var layerIdentifier = "test_world_map";

      // Called asynchronously to parse and create the WMTS layer
      var createLayer = function(xmlDom) {
        // Create a WmtsCapabilities object from the XML DOM
        var wmtsCapabilities = new WorldWind.WmtsCapabilities(xmlDom);
        // Retrieve a WmtsLayerCapabilities object by the desired layer name
        var wmtsLayerCapabilities = wmtsCapabilities.getLayer(layerIdentifier);
        // Form a configuration object from the WmtsLayerCapabilities object
        var wmtsConfig = WorldWind.WmtsLayer.formLayerConfiguration(wmtsLayerCapabilities);

        // Create the WMTS Layer from the configuration object
        var wmtsLayer = new WorldWind.WmtsLayer(wmtsConfig);


        // Add the layers to WorldWind and update the layer manager
        wwd.addLayer(wmtsLayer);
      };

      // Called if an error occurs during WMTS Capabilities document retrieval
      var logError = function(jqXhr, text, exception) {
        console.log("There was a failure retrieving the capabilities document: " + text + " exception: " + exception);
      };

      $.get(serviceAddress).done(createLayer).fail(logError);
    </script>
  </body>

</html>
11.4.3. Python / Jupter Notebook
11.4.3.1. WCS and WCPS Clients
The following two Python libraries make it easy to access and query datacubes in rasdaman for Python developers:
WCS python library (GitHub repo, documentation) allows to extract information about datacubes: available datacubes, their bounding box/axes, range type, metadata, etc.
WCPS python library (GitHub repo, documentation) allows to dynamically build WCPS queries and execute on a WCPS server.
11.4.3.2. OWSLib
OWSLib is a Python package that helps with programming clients for OGC services such as WCS, WCPS, or WMS. To install it follow the official installation instructions. Example usage for WCS follows below.
>>> # Import OWSLib in Python once installed
... from owslib.wcs import WebCoverageService

>>> # Create coverage object
... my_wcs = WebCoverageService('http://ows.rasdaman.org/rasdaman/ows',
...                             version='2.0.1')

>>> # Get list of coverages
... print my_wcs.contents.keys()
['RadianceColor', 'test_irr_cube_2', 'test_mean_summer_airtemp',
 'test_double_1d', 'INSPIRE_EL', 'AverageChlorophyllScaled', 'INSPIRE_OI_RGB',
 'Temperature4D', 'INSPIRE_OI_IR', 'visible_human', 'INSPIRE_WS_LC',
 'meris_lai', 'climate_earth', 'mean_summer_airtemp', 'multiband',
 'ls8_coastal_aerosol', 'NN3_3', 'NN3_2', 'NN3_1', 'NN3_4',
 'AvgTemperatureColorScaled', 'AverageChloroColorScaled', 'lena',
 'Germany_DTM', 'climate_cloud', 'FiLCCoverageBit', 'AverageChloroColor',
 'LandsatMultiBand', 'RadianceColorScaled', 'AvgLandTemp', 'NIR', 'BlueMarbleCov']

>>> # Get geo-bounding boxes and native CRS
... my_wcs.contents['AverageChlorophyllScaled'].boundingboxes
[{'nativeSrs': 'http://ows.rasdaman.org/def/crs-compound?
  1=http://ows.rasdaman.org/def/crs/EPSG/0/4326&
  2=http://ows.rasdaman.org/def/crs/OGC/0/UnixTime',
  'bbox': (-90.0, -180.0, 90.0, 180.0)}]

>>> # Get axis labels
... my_wcs.contents['AverageChlorophyllScaled'].grid.axislabels
['Lat', 'Long', 'unix']

>>> # Get dimension
... my_wcs.contents['AverageChlorophyllScaled'].grid.dimension
3

>>> # Get grid lower and upper bounds
... my_wcs.contents['AverageChlorophyllScaled'].grid.lowlimits
['0', '0', '0']

>>> my_wcs.contents['AverageChlorophyllScaled'].grid.highlimits
['119', '239', '5']

>>> # Get offset vectors for geo axes
... my_wcs.contents['AverageChlorophyllScaled'].grid.offsetvectors
[['-1.5', '0', '0'], ['0', '1.5', '0'], ['0', '0', '1']]

>>> # For coverage with time axis get the date time values
... my_wcs.contents['AverageChlorophyllScaled'].timepositions
[datetime.datetime(2015, 1, 1, 0, 0), datetime.datetime(2015, 2, 1, 0, 0),
 datetime.datetime(2015, 3, 1, 0, 0), datetime.datetime(2015, 4, 1, 0, 0),
 datetime.datetime(2015, 5, 1, 0, 0), datetime.datetime(2015, 7, 1, 0, 0)]
11.4.3.3. rasdapy3
rasdapy3 is a client API for rasdaman that enables building and executing rasql queries within python. Best practice code snippets are also provided.
11.4.4. Access from R
Accessing rasdaman from R is possible in three ways right now:
RRasdaman enables connecting to rasdaman, executing rasql queries, and retreiving results. Note that it is only for rasql queries, so it is not suitable for querying geo-referenced coverages.
CubeR allows convenient execution of WCPS queries directly from R. Check also this accompanying presentation.
ows4R provides an interface to OGC Web services, including Web Coverage Service (WCS) which is supported by rasdaman. Steps to install
ows4Rpackage and its dependencies on Ubuntu 20.04:sudo apt-get install libsodium-dev libudunits2-dev sudo R install.packages("sodium") install.packages("keyring") install.packages("geometa") install.packages("units") install.packages("sf") install.packages("ows4R")
For more details check the ows4R WCS tutorial.
11.4.5. OpenLayers
Simple example to setup a web page with a map from a WMS server using OpenLayers:
<html>
  <head>
     <link rel="stylesheet" href="https://cdnjs.cloudflare.com/ajax/libs/openlayers/3.8.2/ol.css"></link>
     <script src="https://cdnjs.cloudflare.com/ajax/libs/openlayers/3.8.2/ol.js"></script>
     <script>
      document.addEventListener("DOMContentLoaded", function(event) {
        var layers = [
          new ol.layer.Tile({
            source: new ol.source.TileWMS({
              url: "https://ahocevar.com/geoserver/wms",
              params: {'LAYERS': 'ne:NE1_HR_LC_SR_W_DR'}
            })
          }),
          new ol.layer.Tile({
            source: new ol.source.TileWMS({
              url: "http://ows.rasdaman.org/rasdaman/ows",
              params: {'LAYERS': 'AvgTemperatureColorScaled'}
            })
          })
        ];
        var map = new ol.Map({
          layers: layers,
          target: 'map',
          view: new ol.View({
            center: [7.5, 53.15178], projection : "EPSG:4326", zoom: 6
          })
        });
      });
     </script>
  </head>
  <body>
    <div id="map" style="width: 100%; height: 95vh"> </div>
  </body>
</html>
An example to setup a web page with a map from a WMTS server using OpenLayers:
<html>
    <head>
      <meta charset="utf-8">
      <title>WMTS + World Base Map</title>
      <link rel="stylesheet" href="https://cdn.jsdelivr.net/npm/ol@latest/ol.css">
      <style>
        html, body, #map {
          margin: 0;
          width: 100%;
          height: 100%;
        }
      </style>
    </head>

    <body>
        <div id="map"></div>

        <script src="https://cdn.jsdelivr.net/npm/ol@latest/dist/ol.js"></script>

        <script>
        fetch("http://localhost:8080/rasdaman/ows?SERVICE=WMTS&REQUEST=GetCapabilities&version=1.0.0")
          .then(r => r.text())
          .then(text => {

            const parser = new ol.format.WMTSCapabilities();
            const result = parser.read(text);

            const wmtsOptions = ol.source.WMTS.optionsFromCapabilities(result, {
              layer: "test_wms_world_map_gradient",
              matrixSet: "EPSG:4326"
            });

            const wmtsLayer = new ol.layer.Tile({
              source: new ol.source.WMTS(wmtsOptions)
            });

            // World base map
            const baseLayer = new ol.layer.Tile({
              source: new ol.source.OSM()
            });

            const map = new ol.Map({
              target: "map",
              layers: [
                baseLayer,
                wmtsLayer
              ],
              view: new ol.View({
                projection: "EPSG:3857",
                center: ol.proj.fromLonLat([10.2155, 51.6725]),
                zoom: 5
              })
            });

          });
        </script>
    </body>
</html>
11.4.6. Leaflet
Simple example to setup a web page with a map from a WMS server using Leaflet:
<html>
  <head>
    <link rel="stylesheet" href="https://unpkg.com/leaflet@1.6.0/dist/leaflet.css"/>
    <script src="https://unpkg.com/leaflet@1.6.0/dist/leaflet.js"></script>
    <script>
      document.addEventListener("DOMContentLoaded", function(event) {
        var map = new L.Map('map', {
          center: new L.LatLng(40, 52),
          zoom: 3, attributionControl: true, zoomControl: true, minZoom: 2
        });
        var wmsLayer = L.tileLayer.wms("http://ows.rasdaman.org/rasdaman/ows", {
          version: '1.3.0', layers: 'AvgTemperatureColorScaled', format: 'image/png'
        });
        map.addLayer(wmsLayer);
      });
    </script>
  </head>
  <body>
    <div id="map" style="width: 100%; height: 100%;"> </div>
  </body>
</html>
11.4.7. ArcGIS
ArcGIS Online does not directly allow accessing 3rd party services, however such a service can be connected into some existing ArcGIS Server instance. In the following, the ArcGIS Online documentation is cited.
OGC WMS or WMTS layers can be added to ArcGIS Online to maps in Map Viewer or Map Viewer Classic to scenes in Scene Viewer, and as items to ArcGIS.
11.4.8. QGIS
11.4.8.1. WCPS Plugin
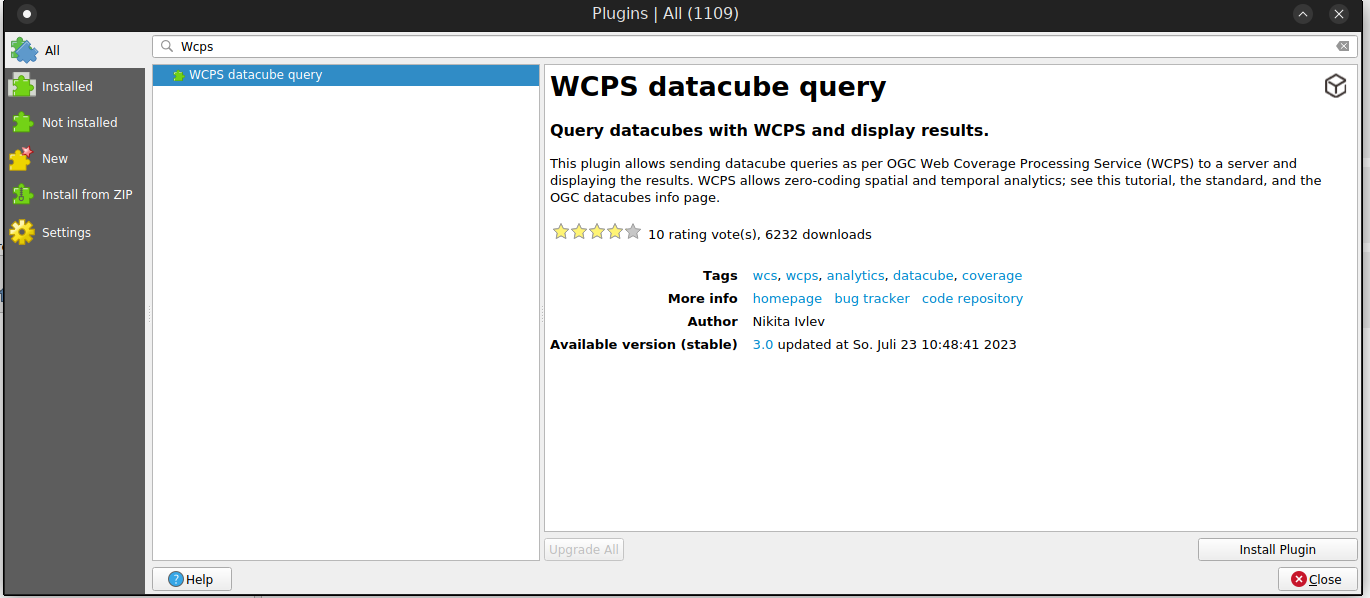
The WCPS plugin allows sending datacube queries as per OGC Web Coverage Processing Service (WCPS) to a server and displaying the results directly in QGIS.
11.4.8.1.1. Installation
Select QGIS menu
Plugins→Manage and Install Plugins, then search forwcps; this should return the pluginWCPS datacube query;Click
Install Pluginto install it in QGIS;Now you can access the plug-in via the QGIS Menu
Plugins→WcpsClient1→WCPS 1.0 Client, or click on the new cube icon on the toolbar.
11.4.8.1.2. Server configuration
To start working with the plugin, you need to add a server to which requests
will be sent. To do this, click on the New button and specify a name and
a rasdaman endpoint URL, then click OK. After adding the server data,
select it from the available ones in the drop-down list.
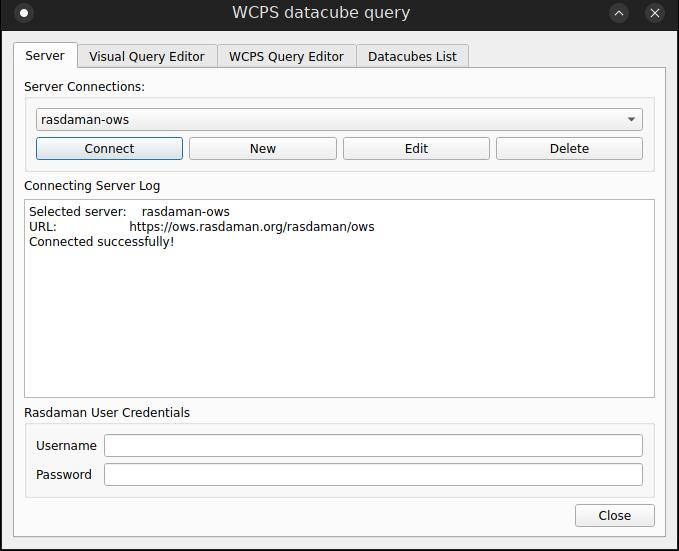
If the server requires basic header authentication to send requests, you can specify
credentials in the Username and Password fields.
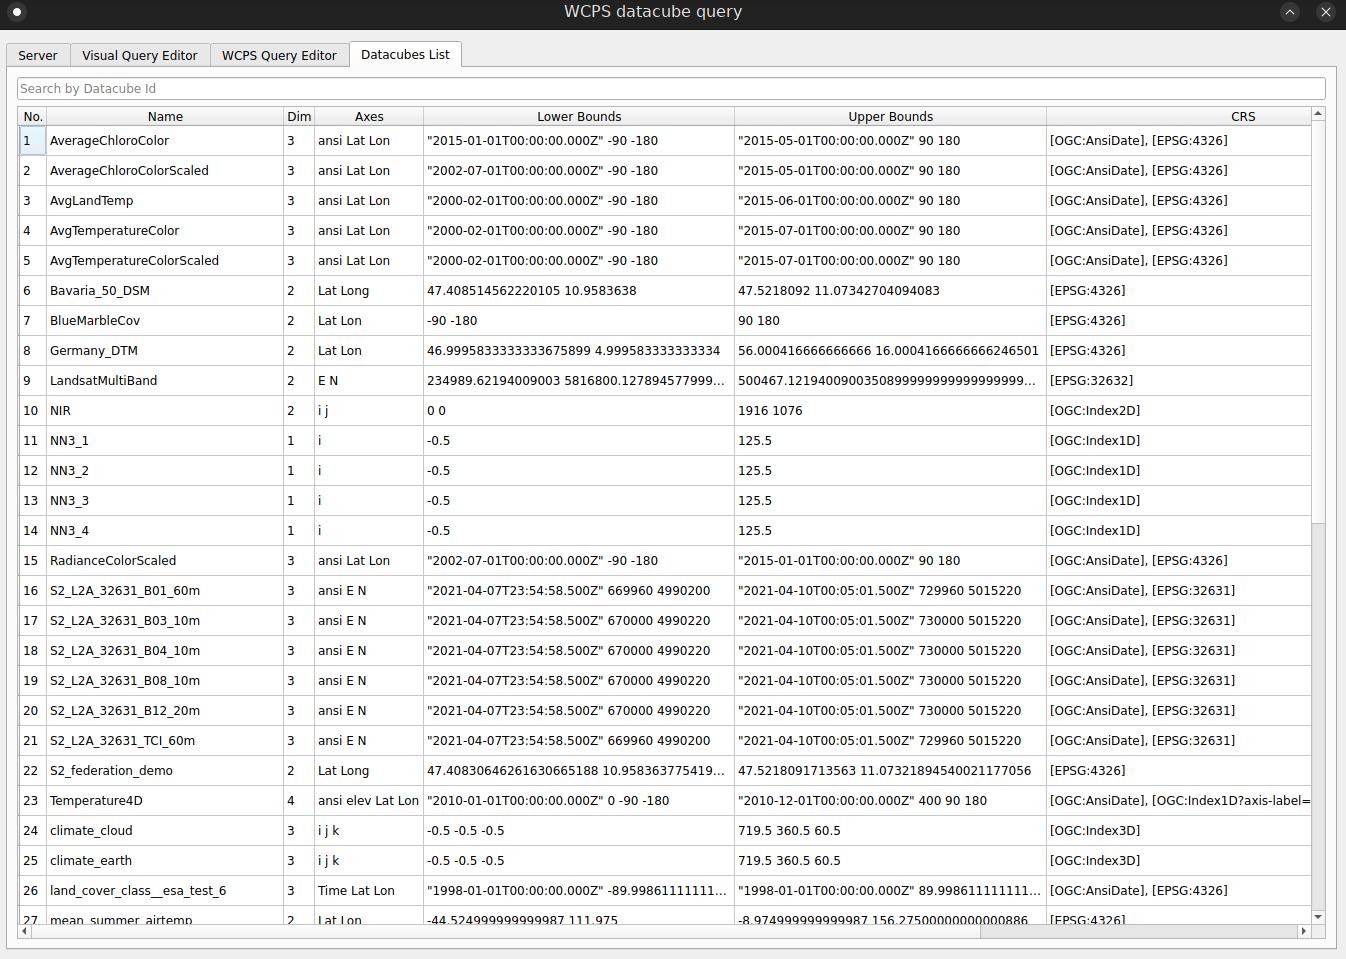
After specifying all the necessary data, click the Connect button to connect
to the server. This should show a list of all available coverages on the
Datacubes List tab.
11.4.8.1.3. Query writing
You can create a query using the WCPS Query Editor and Visual Query
Editor tabs.
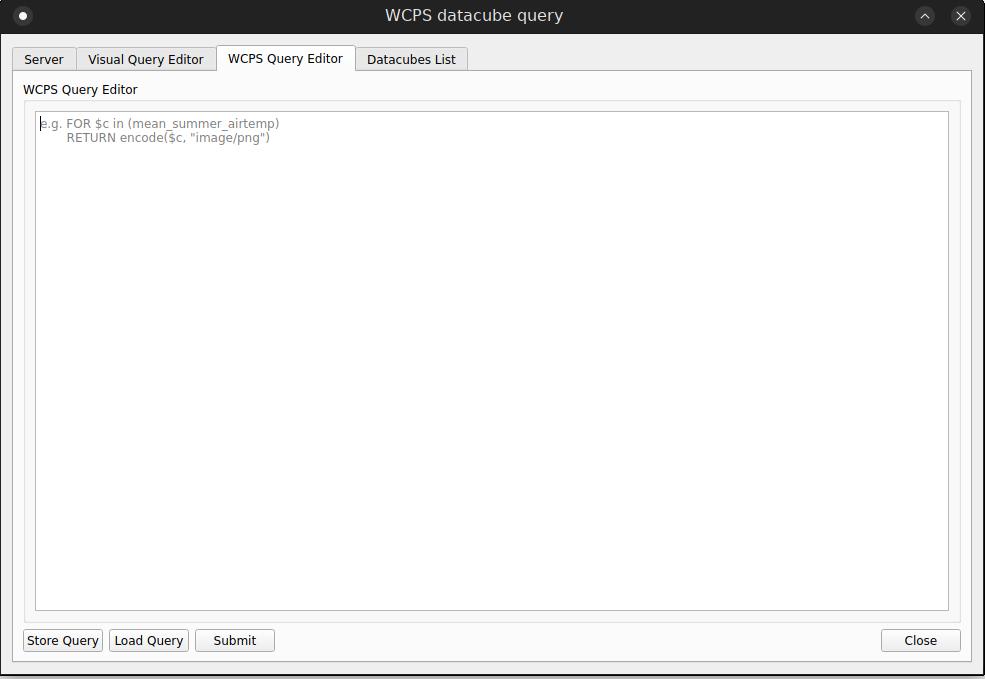
On WCPS Query Editor tab the query is entered as free text. Queries can
be persisted and loaded with Store Query and Load Query buttons. To
submit a query to the server, click Submit button. If the request is
successful, a window for choosing further actions with the result will be
shown.
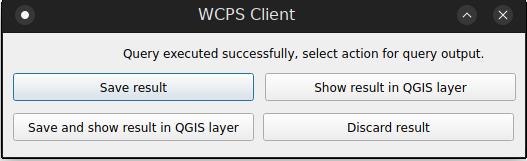
To save the query result click
Save resultbuttonTo show the file in QGIS click
Show result in QGIS layerbuttonTo save and show the file in QGIS click
Save and show result in QGIS layerbutton.To ignore the result click
Discard resultbutton
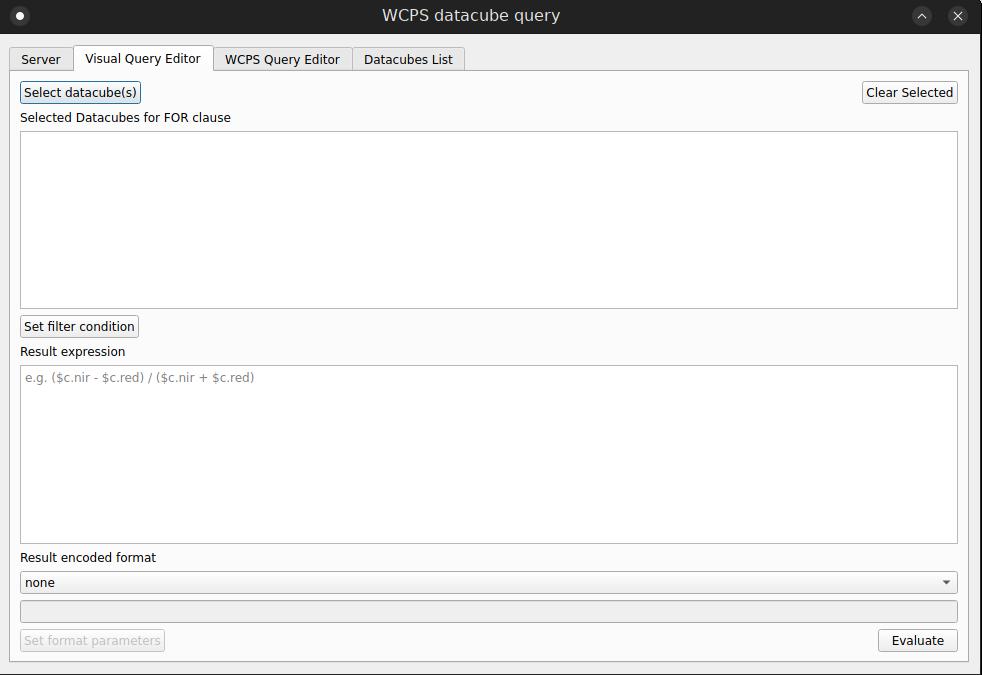
Visual Query Editor tab allows to construct the high-level structure of
the query with buttons and inputs with support for code-completion.
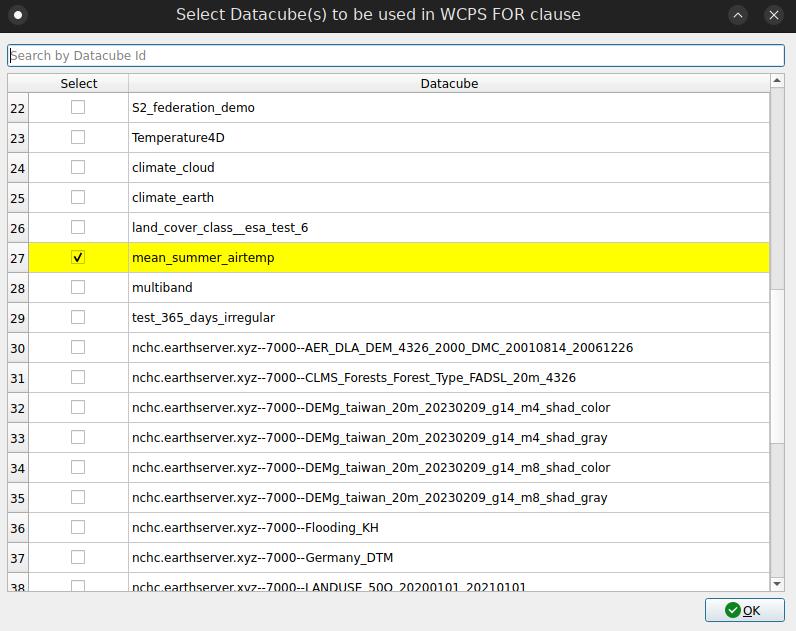
To add datacubes over which you will iterate in the for part, click Select datacube(s)
button, which allows to select/deselect datacubes from the list of available
ones on the server.
To clear all selected datacubes from the list, click Clear Selected button.
To add filtering to your query (a WHERE clause) click on
Set filter condition button and enter necessary conditions.
Result expression field should contain the processing expression that
should be calculated as a result. Select a format in which the result will be
encoded in the drop-down list; to specify a custom format, select custom from
the drop-down list and write it in the corresponding field.
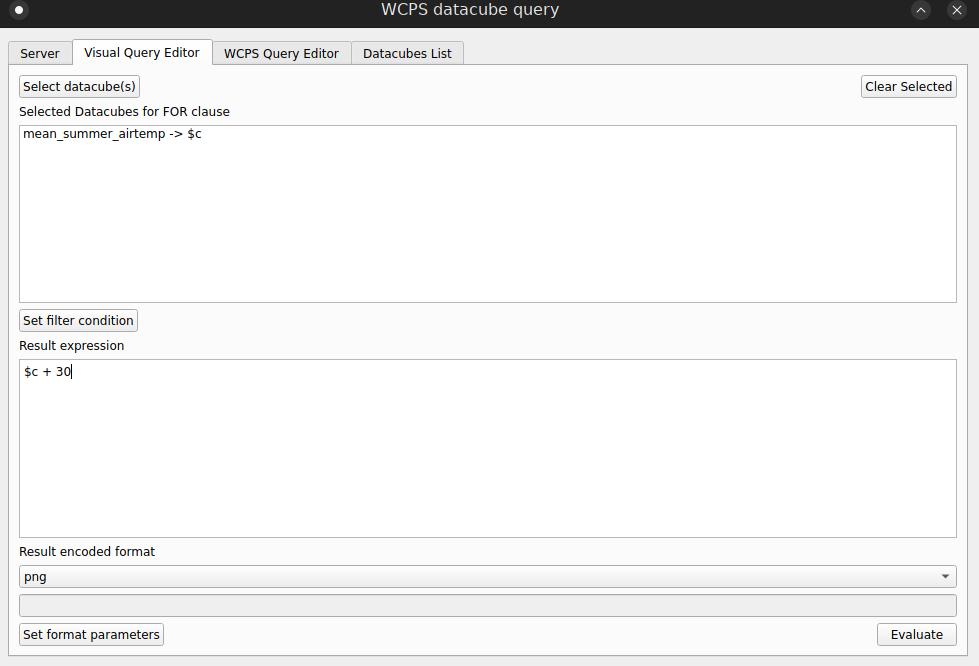
You can also specify format parameters (e.g. set colorMap for PNG encoding)
by clicking on the Set format Parameters button and entering them
in a special field in the window that opens. After specifying all the required data,
click Evaluate button to send the generated query. If the query is successful,
you will see a window for choosing further actions with the results of the request, which was
described previously here.
11.4.8.2. WCS Plugin
The WCS 2 plugin allows to connect to rasdaman, query the available coverages, download a spatio-temporal subset of a coverage (optionally with band subsetting / reordering). The downloaded coverages are directly loaded as layers into QGIS.
11.4.8.2.1. Installation
Select QGIS menu
Plugins→Manage and Install Plugins, then search forogc wcs 2; this should show the pluginWCS 2(among possibly other plugins);Click
Install Pluginto install it in QGIS;Now you can access the plug-in via the QGIS Menu
Plugins→WcsClient2→WCS 2 Client.
11.4.8.2.2. Guidelines
Usage guidelines can be found on the “Help” tab of the plugin (step 3. in the previous section on how to access it).
11.4.8.3. WMS / WMTS
QGIS has native support for querying WMS servers, check the official documentation for further information.
11.4.8.4. Plugin development
Below are some common steps needed when changing the plugin’s code.
Clone the plugin code repository
The
metadata.txtfile configures the information displayed on the QGIS plugin page; the version should be updated in this file before uploading a new plugin version to the QGIS plugin repository.Install the
pb_toolhelper tool; this tool depends on thepb_tool.cfgconfiguration file, which should be updated whenever files are added or removed:pip3 install pb_tool
To deploy a new version to your local QGIS application:
pb_tool deploy
To create a zip archive that can be uploaded to the QGIS plugin repository:
pb_tool zip
11.4.8.4.1. Debug with Pycharm
With PyCharm professional (not community) it is possible to debug the plugin while it is running in QGIS.
Create a symbolic link from the repostitory e.g.
~/QgisWcpsPlugin-repoto~/.local/share/QGIS/QGIS3/profiles/default/python/plugins/wcps_client.In PyCharm, click on top menu
Run>Edit Configurations, and thenSelect
Add new run configuration>Python Debug Serverwith these configurations:Name:
Debug QGISIDE host name:
localhostPort:
5678
Note the pip install command shown in the dialog and run it to install the package required by PyCharm:
pip install pydevd-pycharm~=251.23774.444
Open the code project at
~/.local/share/QGIS/QGIS3/profiles/default/python/plugins/wcps_clientin PyCharm.Edit
wcps_client.pyat functioninitGui(self), then uncomment these lines to enable debug ([1]):import pydevd_pycharm pydevd_pycharm.settrace('localhost', port=5678, stdoutToServer=True, stderrToServer=True)Click on
Run>Debug QGISand startqgisfrom the terminal. On Ubuntu 24.04 it may be necessary to explicitly setPYTHONPATHto reference the system Python packages:export PYTHONPATH="/usr/share/qgis/python:$HOME/.local/share/QGIS/QGIS3/profiles/default/python:$HOME/.local/share/QGIS/QGIS3/profiles/default/python/plugins:/usr/share/qgis/python/plugins:/usr/lib/python312.zip:/usr/lib/python3.12:/usr/lib/python3.12/lib-dynload:/usr/local/lib/python3.12/dist-packages:/usr/lib/python3/dist-packages:$HOME/.local/share/QGIS/QGIS3/profiles/default/python" qgis
Starting QGIS will trigger a breakpoint in PyCharm at the line with
pydevd_pycharm: pressF9to resume and allow QGIS to start.Set a breakpoint at the place where you want to debug, e.g. inside the function
handleGetCapabilitiesResponse()ofwcps_client_dialog.py.Load the WCPS Datacube Query plugin in QGIS and click on
Connectbutton to connect to the OWS endpoint for fetching coverages. PyCharm will stop at the breakpoint and you can continue with debugging operations.
Note
If
[1]is enabled and PyCharm’s attach debugger is not running, then QGIS will fail to start the plugin.Comment out
[1]when finished debugging before making a patch for submitting to the rasdaman patchmanager.
11.4.9. Command-line tools
It’s straightforward to make individual OGC WCS / WCPS / WMS requests from the
terminal. Examples with curl follow.
Make a GetCapabilities request:
curl "http://ows.rasdaman.org/rasdaman/ows\
?service=WCS&version=2.0.1&request=GetCapabilities"
Execute a WCPS query with a ProcessCoverages request:
curl "http://ows.rasdaman.org/rasdaman/ows" -o test.png --data-urlencode \
'service=WCS&version=2.0.1&request=ProcessCoverages&query=\
for c in (mean_summer_airtemp) return encode(c, "png")'
Upload files to be processed with
decode()operator, see here.When the server requires basic authentication for a request, the rasdaman user credentials can be specified with the
--useroption, e.g.curl --user "rasadmin:rasadmin" \ "http://localhost:8080/rasdaman/ows? service=WCS&version=2.0.1&request=DeleteCoverage&coverageId=test_coverage"
11.4.10. Rasql Web Console
The rasql web console is a simple web-based query frontend for rasql (not WCPS). It allows typing queries into a text window, submit them to a server, and display or download the results.
The code resides in $RMANHOME/share/rasdaman/www/rasql-web-console. For use in Web clients, the directory
must be copied to some directory where a Web server (e.g. Apache) can expose it. Configure js/config.js file
for a running petascope endpoint and default credentials to be used for demo queries provided in js/queries.json.
The output display style can optionally be selected through a prefix to the query. Adding one of the following prefix strings before the query attempts to display the output in specialized widgets:
image>>visualizes a 2D image result; example:image>>select encode(..., "jpeg") from ...diagram>>visualizes 1D CSV-encoded data as a diagram; example:diagram>>select encode(..., "csv") from ...text>>visualizes a result as text; example:text>>select dbinfo(...) from ...
diagram accept additional parameters in parentheses,
written as comma-separated key=value list:
type: diagram type, one of:linear,area,scatterwidth: widget display size in pixelsheight: height display size in pixels
Example diagram(type=area,width=300)>>select encode(..., "csv") from ....
If no prefix is specified, the result gets downloaded:
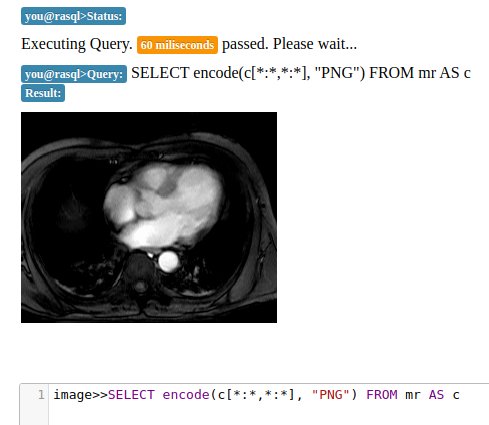
Figure 11.16 Example of a 2D image result.
11.2.5. Comments
WCPS supports SQL-like commenting styles:
Single line comments start with
--. Any text following--to the end of the line will be ignored. Example:Multi-line comments start with
/*and end with*/. Any text between/*and*/are ignored. Example: