10. raswct Web Client Toolkit Developer Guide
10.1. Preface
10.1.1. Overview
Purpose of the raswct (“rasdaman Web Client Toolkit”) toolkit is to allow developers creating Web user interfaces for displaying data from a raster database.
10.1.2. Implementation
The toolkit is developed in Javascript and uses popular libraries like jQuery. Its structure follows the principle of separating data transmission and processing from the presentation, the two main namespaces reflecting this philosophy:
Query namespace - containing all the classes that can be used to retrieve data from a server, be it a simple HTTP server or a rasdaman server.
Widget namespace - containing all the classes that can be used to display the data in meaningful ways
This document describes how to create widgets and modify them to suit
particular purposes. At the end of each widget description an example of
use is given. More examples can be found in the applications/raswct/demo folder.
10.1.3. Audience
Information in this manual is intended primarily for Web application developers.
10.1.4. Rasdaman Documentation Set
This manual should be read in conjunction with the complete rasdaman documentation set which this guide is part of. The documentation set in its completeness covers all important information needed to work with the rasdaman system, such as programming and query access to databases, guidance to utilities such as raswct, release notes, and additional information on the rasdaman wiki.
The rasdaman Documentation Set consists of the following documents:
Installation and Administration Guide
Query Language Guide
C++ Developer’s Guide
Java Developer’s Guide
raswct Developer’s Guide
the rasdaman wiki, accessible at www.rasdaman.org
10.2. Introduction
10.2.1. Purpose and Use
This toolkit allows developers to easily create individualized Web interfaces for displaying multi-dimensional raster data. For example, diagrams serve to present 1-D query results, images and a geo Web Map interface serve to display 2-D query results. 3-D displays are under development. All such data can stem from multi-dimensional database contents, such as 1-D extracts from a 4-D climate data set.
Database queries can be hidden behind interactive parameter setting through sliders, gauges, etc., thereby hiding the complexity of the query language to casual users.
Crafting such Web interfaces often is as easy as writing HTML, without resorting to JavaScript, which is the raswct implementation language. That said, all JavaScript is available to advanced developers for designing high-end interactive data interfaces.
10.2.2. Implementation
The raswct toolkit is developed in Javascript and uses popular libraries, like jQuery. Its structure follows the principle of separating data transmission and processing from the presentation:
The Query namespace, Rj.query, contains all the classes for data retrieval from a server, be it a simple HTTP server or a rasdaman server.
The Widget namespace, Rj.widget, contains all the classes for displaying data in various ways.
The Utility namespace, Rj.util, contains various utility functions that help creating interaction widgets.
10.2.3. References
The raswct toolkit is heavily used in the EarthLook geo service standards showcase.
10.3. Utility Namespace
10.3.1. Bindable
Rj.util.Bindable is a trait and it is used as an interface for binding objects.
10.3.2. Binder Manager
Rj.util._BinderManager class manages the binders between Rj objects.
10.3.3. Cache Engine
Rj.util._CacheEngine singleton class acts as a key value store for caching misc data directly in the browser.
10.3.4. Config Manager
Rj.util._ConfigManager class acts as a singleton to store the configuration data used across raswct modules.
10.3.5. Constants
Rj.util.Constants class contains all the constants needed across the toolkit.
10.3.6. CSV Parser
Rj.util.CSVParser class is designed to help with the parsing of CSV data produced by rasdaman server or petascope wcps services to native javascript objects.
10.3.7. Data Series
Rj.util.DataSeries class is an discrete indexed array object, similar to how a 2D diagram is represented e.g. [[1, 2], [3, 6]] where the domain is {1,3} and the codomain is {2,6}.
10.3.8. Error Manager
Rj.util._ErrorManager singleton class manages the error messages, displaying them to the user or just reporting them in the dev console.
10.3.9. Global State
Rj.util.GlobalState class provides a common area for defining shared static information across modules.
10.3.10. Map layer
Rj.util.MapLayer class defines a layer used as an abstraction for map layers that can be added to any Rj.widget.Map
10.3.11. Multidimensional Array
Rj.util.MultiDimArray class is a representation of a multidimensional array that has easy to use accessor methods.
10.3.12. Notification Manager
Rj.util._NotificationManager class defines a notification diaglogue to show success/failure to users.
10.3.13. Observable
Rj.util.Observable is a trait and it is used as an interface for event communication.
10.3.14. Util
This file extends the functionality of the underscore library to utilities that are needed across the project.
10.3.15. XMLDoc
Rj.util.XMLDoc class provides a series of utility functions for easier parsing of XML docs using XPath.
10.4. Query Namespace
10.4.1. Executable
Description
Rj.query.Executable is a trait and it should be used in the composition of any query classes that can be evaluated by a services.
Atrributes
Name |
Type |
Description |
- cached |
Object |
Configuration for the cached property, default it contains { value: false } |
Methods
Name |
Parameters |
Return Type |
Description |
+ evaluate() |
callback: Function, persistent: Bool |
Evaluates the query and calls a corresponding callback function |
|
- fireCallbacks() |
response: Object, httpStatus: Int |
Iterate array of callback functions and trigger these functions by input response and httpStatus values |
|
- evaluateCached() |
transport: Rj.query.Transport, callback: Function |
Check if Rj.util.CacheEngine contains a response before applying a callback |
|
- evaluateRaw() |
transport: Rj.query.Transport, callback: Function |
Send request from transport to server to get response before applying a call back |
10.4.2. Transport
Description
Rj.query.Transport is a trait and it is used by the Executable trait to send the queries to the server to be evaluated.
Atrributes
Name |
Type |
Description |
- serviceUrl |
String |
Petascope endpoint to send request |
- serviceHttpMethod |
String |
HTTP method to send request (default: POST) |
- params |
Object |
An object to contain param (keys, values) for the request |
- parseResponse |
Object |
Parse the response from the request |
- binary |
Bool |
If reponse is not in text format (default: true) |
Methods
Name |
Parameters |
Return Type |
Description |
+ toHashCode() |
Create a String request from all properties and calculate a hashcode from it |
10.4.3. LiteralQuery
Description
Rj.query.LiteralQuery is class to create a literal query trait provides functionality for defining string queries containing parameters that can be changed. This is an interface class for subclasses to implements. A literal query example: e.g “SELECT @col FROM @col WHERE @cond”
Atrributes
Name |
Type |
Description |
- query |
String |
The litteral query, e.g. “SELECT @col FROM @col” |
- variables |
Object |
An object of form {variable: value}, {“@col” : “mr”} |
Methods
Name |
Parameters |
Return Type |
Description |
+ setVariable() |
varName: String, value: String |
Set a variable to a certain value. |
|
+ getVariable() |
varName: String |
String |
Get a value for a a certain variable. |
+ toString() |
String |
Returns the string representation after the query is expanded by replacing the vars. |
|
+ isReady() |
Bool |
Indicates if all the variables in the query are set. |
|
- expand() |
String |
Iterate the variables array and replace the place holders with values from the array |
10.4.4. WCPS Query
Description
Rj.query.WCPSQuery is class to create a WCPSQuery object which can send WCPS queries to a service that can process them and parse the result to obtain meaningul data for Widgets.
Atrributes
Name |
Type |
Description |
- binaryFormat |
bool |
Should be set to true if the query returns a binary format (e.g. image) instead of text format. |
- WCPSService |
String |
Petascope endpoint for WCPS query. |
Methods
Name |
Parameters |
Return Type |
Description |
+ transport() |
Returns a Rj.query.Transport object that can be used internally by Executable trait |
10.4.5. Rasql Query
Description
Rj.query.RasQuery is class to create a RasQuery object which is a Rasql query. All queries defined in rasql can be used with this class.
Methods
Name |
Parameters |
Return Type |
Description |
+ transport() |
Returns a Rj.query.Transport object that can be used internally by Executable trait |
||
- parseResponse() |
Parse the text result from rasdaman as JSON object |
10.5. Widget Namespace
10.5.1. Base Widget
Description
Rj.widget._BaseWidget is base class for widgets, exposing methods for easy communication between the current widget and other widgets on the page. All widgets also contain a descendant of Rj.query.LiteralQuery which it can use to receive information from ther server.
Atrributes
Name |
Type |
Description |
- selector |
CSS3 / XPath |
A CSS3/XPath selector used as indentifier for the position of the widget. |
Methods
Name |
Parameters |
Return Type |
Description |
+ show() |
Make the widget visible. By default widgets are rendered invisible |
||
+ hide() |
Make the widget invisible |
||
+ destroy() |
Destroy the widget |
||
- render() |
laceholder function that should be extended by any showing widget |
||
- clear() |
Registers a new handler for a specific event |
||
- refresh() |
Removes the widget from the container and re-renders it |
Warning
This is a base class for graphs so it shouldn’t be initialized or used except for extending the current graph system.
10.5.2. Input Widget
Description
Rj.widget._InputWidget is a simple grouper class that helps better define the relationships between widgets.
Attributes
Name |
Type |
Description |
- value |
string |
The value displayed in widget. |
Warning
This is a base class for graphs so it shouldn’t be initialized or used except for extending the current graph system.
10.5.3. Knob Widget
Description
Rj.Widget.Knob class defines a knob widget.
Attributes
Name |
Type |
Description |
- min |
Int |
The lower bound of the knob. |
- max |
Int |
The higher bound of the knob. |
- value |
Int |
The initial value of the knob. |
- reverse |
Bool |
If true, the values are distributed backwards (from 360 degrees to 0 degrees). |
- snap |
Int |
The number of degrees from which the knob is snapped to 0. |
Methods
Name |
Parameters |
Return Type |
Description |
- setValue() |
value: Int |
Set value for knob’s value. |
|
- render() |
Render this knob widget |
Examples
The following code creates a Knob object within a
<div id="knob"></div> element:
var knob = new Rj.Widget.Knob(0, 10, 5, false, 20);
knob.renderTo("knob");
10.5.4. Slider Widget
Description
Rj.widget._Slider class defines a slider widget. This class is private and should be instatiated on its own. See Rj.widget.HorizontalSlider and Rj.widget.VerticalSlider if you need to create a slider.
Attributes
Name |
Type |
Description |
- min |
Int |
The min value the slider can take |
- max |
Int |
The max value the slider can take |
- orientation |
String |
The orientation of the slider, either vertical or horizontal |
- step |
Float |
The step size to which the slider should be increased on slide action |
- tooltip |
Bool |
True if the slider should have a tooltip, false otherwise |
- label |
String |
The label shown in the tooltip |
- height |
Int |
The height of the slider |
- width |
Int |
The width of the slider |
- instantChange |
Int |
If true the slider will change the value to the slide movement of the incrementor, otherwise only to the mouse up movement |
Methods
Name |
Parameters |
Return Type |
Description |
- createTooltip() |
Creates a tooltip attached to the slider |
||
- prepareRendering() |
Prepares the rendering process for the dojoRenderer |
||
- finishRendering() |
Finishing touches to the slider |
||
- renderDojoSlider() |
Renders the slider using the dojo library widget |
||
- render() |
Renders the slider with all its components |
||
- getDojoClass() |
Return Rj.widget._Slider.DojoSliderClasses |
||
- clear() |
Destroy the slider widget recursively |
||
- refresh() |
Refresh the widget by using softRefresh() with timeout |
||
- softRefresh() |
Refresh the widget by using clear() and render() |
10.5.5. Horizontal Slider Widget
Description
Rj.widget.HorizontalSlider class defines a horizontal slider that can be used to slide through an interval of numerical values. It extends Rj.widget._Slider class.
10.5.6. Vertical Slider Widget
Description
Rj.widget.VerticalSlider class defines a vertical slider that can be used to slide through an interval of numerical values. It extends Rj.widget._Slider class.
10.5.7. Output Widget
Description
Rj.widget._OutputWidget is a simple grouper class that helps better define the relationships between widgets.
Warning
This is a base class for graphs so it shouldn’t be initialized or used except for extending the current graph system.
10.5.8. Binary Image Widget
Description
Rj.widget.BinaryImage class defines a binary image widget that can consume uint8 data and transform it into a image that can be displayed in the browser.
Attributes
Name |
Type |
Description |
- width |
Int |
The width of the image |
- height |
Int |
The height of the image |
- binaryData |
String |
Image in base64 String |
Methods
Name |
Parameters |
Return Type |
Description |
- generateBase64Data() |
Convert an array of buffer data to base64 String |
||
- render() |
Render the base64 String to an image and display |
10.5.9. Map Widget
Description
Rj.widget.Map class defines a widget used for displaying maps composed of several layers.
Attributes
Name |
Type |
Description |
- map |
OpenLayers.Map |
OpenLayers map object |
- width |
Int |
The width of the map |
- height |
Int |
The height of the map |
Methods
Name |
Parameters |
Return Type |
Description |
- clear() |
Destroy the OpenLayers map object and clear the div container of it |
||
- render() |
Render the base64 String to an image and display |
10.5.10. Gauge Widget
Description
Rj.Widget.Gauge class defines a circular gauge widget.
Attributes
Name |
Type |
Description |
- value |
Int |
The initial value displayed. |
- min |
Int |
The lower bound of the displayed values. |
- max |
Int |
The upper bound of the displayed value. |
- title |
String |
The title of the widget. |
- label |
String |
The label of the widget. |
- widthScale |
Float |
The scale at which the widget is displayed. 1 is the reference point. |
- showMinMax |
Bool |
Shows or hides the bounding values. |
Methods
Name |
Parameters |
Return Type |
Description |
- render() |
Display the Gauge widtget |
Examples
The following example will display a gauge within a
<div id ="gauge"></div> element.
var gauge = new Rj.Widget.Gauge(null, 24);
gauge.renderTo("gauge");
Gauge overview
Below the gauges are listed which are available currently; they are described in the subsequence subsections.
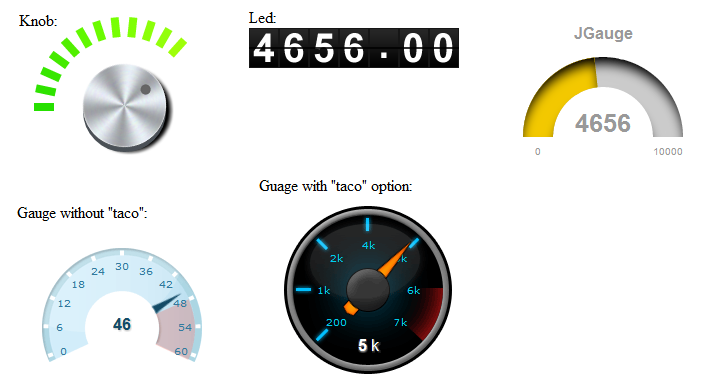
10.5.11. Led Widget
Description
Rj.Widget.Led class defines a led counter widget.
Attributes
Name |
Type |
Description |
- value |
Float |
The initial value displayed. |
- intDigits |
int |
The number of digits of the display. |
- fracDigits |
Bool |
The number of fractional digits to display. |
Methods
Name |
Parameters |
Return Type |
Description |
- render() |
Display the Led widtget |
Examples
The following example will display a LED within a <div id = “led”></div> element.
var led = new Rj.Widget.Led(100.54, 3, 2);
led.renderTo("led");
10.5.12. SpeedoMeter Widget
Description
Rj.widget.SpeedoMeter class defines a speedo meter widget.
Attributes
Name |
Type |
Description |
- value |
Float |
The initial value displayed |
- labelSuffix |
String |
The suffix of the label |
Methods
Name |
Parameters |
Return Type |
Description |
- render() |
Display the SpeedoMeter widtget |
10.5.13. Tooltip Widget
Description
Rj.widget.ToolTip class defines a a tooltip widget.
Attributes
Name |
Type |
Description |
- value |
String |
Text to be shown |
- pretext |
String |
Pre text to be shown |
- postext |
String |
Post text to be shown |
- adjust |
Object |
Some keys, values to adjust tooltip |
- place |
String |
The place to shown tooltip (default: bottom) |
- mouse |
Bool |
Mouse event on tooltip (default: false) |
- delay |
Int |
Time to show tooltip (default: 1000) |
Methods
Name |
Parameters |
Return Type |
Description |
- render() |
Display the Tooltip widtget |
10.5.14. Diagram Widget
Description
Rj.widget._Diagram class defines a widget used as a base for all diagrams.
Attributes
Name |
Type |
Description |
- title |
String |
The title of this diagram. |
- xLabel |
String |
The title of the X axis. |
- yLabel |
String |
The title of the Y axis. |
- tooltip |
String |
Indicates whether a Tooltip with tips about how the diagram works should be shown. |
- dataSeries |
Rj.util.DataSeries |
The series to be plotted. |
- width |
Int |
The width of the diagram. |
- height |
Int |
The height of the diagram. |
Methods
Name |
Parameters |
Return Type |
Description |
+ getData |
Array |
Returns the data series in the format that is sent to the plot. |
|
+ addDataSeries |
series: Rj.util.DataSeries |
Adds a data series to the diagram as an array of form [ [x,y] , [x1, y1] ]. |
|
+ removeDataSeries |
seriesName: String |
Removes a series from the diagram. |
|
- configure |
cfg: Object |
Object |
Configures the chart object before rendering. All subclasses should override this method in order to add their specific configurations. |
- getSeriesColors |
Array |
Returns an array of series’ colors. |
|
- getSeriesNames |
Array |
Returns an array of series’ names. |
|
- render |
Renders the widget by its id DOM element. |
||
- bindSeries |
series: Rj.util.DataSeries |
Add event listeners for series and then call self._refresh() method. |
Warning
This is a base class for graphs so it shouldn’t be initialized or used except for extending the current graph system.
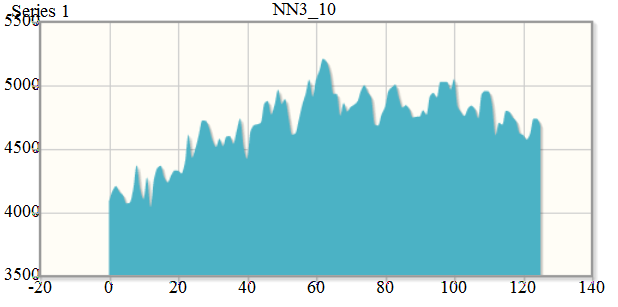
10.5.15. Area Diagram
Description
Rj.Widget.AreaDiagram class defines a widget used for displaying area graphs.
Methods
Name |
Parameters |
Return Type |
Description |
- configure |
cfg: Object |
Object |
Configures the chart object before rendering . |
Examples
JS Code:
var source = "NN3\_10"
//Initialize query
var query = new Rj.query.WCPSQuery('for t1 in (mean_summer_airtemp) return encode (t1[ x(126), y(-10) ], "csv")');
//Create widget
var diagram = new Rj.Widget.AreaDiagram( query, "#chartPlace", source);
// Get diagram axis and labels before data is rendered
diagram.addListener( 'wcps','datapreload',
    function(response){
        var values = [];
        for(var i = 0; i < response.data.length; i++){
            values.push( [i, parseInt(response.data[i], 10)]);
        }
        //Configure the widget labels
        this.configure({
            axes: {
                xaxis: { title: response.domainInfo.axisLabel },
                yaxis: { title : "Values" }
            }
        });
        return { data : values };
    }
);
//Load the data and render the widget
diagram.loadData(true);
HTML Code:
<div id='chartPlace' style='width:600px; height:500px;'>
<!-- The chart will go here -->
</div>
Visual appearance:
10.5.16. Bar Diagram
Description
Rj.Widget.BarDiagram class defines a widget used for displaying bar graphs.
Methods
Name |
Parameters |
Return Type |
Description |
- configure |
cfg: Object |
Object |
Configures the chart object before rendering . |
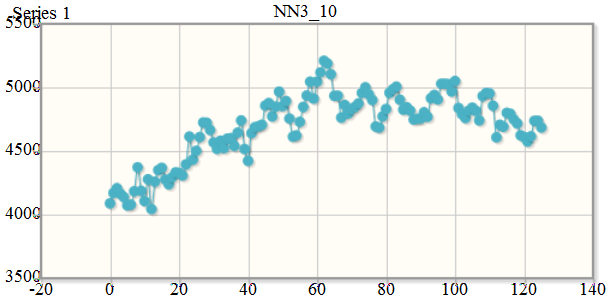
10.5.17. Linear Diagram
Description
Rj.Widget.LinearDiagram class defines a widget used for displaying linear graphs.
Methods
Name |
Parameters |
Return Type |
Description |
- configure |
cfg: Object |
Object |
Configures the chart object before rendering.. |
Examples
JS Code:
//Initialize query
var query = new Rj.query.WCPSQuery('for t1 in (mean_summer_airtemp) return encode (t1[ x(126), y(-10) ], "csv")');
//Create widget
var diagram = new Rj.Widget.LinearDiagram( query, "#chartPlace", source );
// Get diagram axis and labels before data is rendered
// by listening to the datapreload event
diagram.addListener( 'wcps','datapreload',
    function(response){
        // Check if any errors occurred,
        // and if so display a nice error message
        if(response.error){
            $("body").append( "<div id='dialog'>" + response.error + '</div>');
            $( "#dialog" ).dialog({
                modal : true,
                title : 'Parse Error'
            }).show();
            throw "Error while processing the data";
        }
        var values = [];
        for(var i = 0; i < response.data.length; i++){
            values.push( [i, parseInt(response.data[i], 10)]);
        }
        //Configure the widget axes
        this.configure({
            axes : {
                xaxis:{ title : response.domainInfo.axisLabel },
                yaxis: { title : "Values" }
            }
        });
        return { data : [values] };
    }
);
// load data and render widget
diagram.loadData(true);
HTML Code:
<div id='chartPlace' style='width:600px; height:500px;'>
<!-- The chart will go here -->
</div>
Visual appearance:
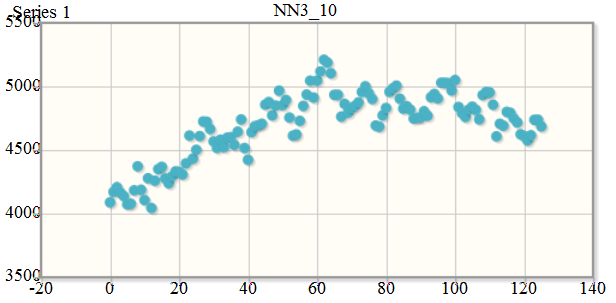
10.5.18. Scatter Diagram
Description
Rj.widget.ScatterDiagram class defines a widget used for displaying scattered graphs.
Methods
Name |
Parameters |
Return Type |
Description |
- configure |
cfg: Object |
Object |
Configures the chart object before rendering. |
Examples
JS Code:
// Initialize query
var query = new Rj.query.WCPSQuery('for t1 in (mean_summer_airtemp) return encode (t1[ x(126), y(-10) ], "csv")');
// Create widget
var diagram = new Rj.Widget.ScatterDiagram(query, "#chartPlace", source);
// Get diagram axis and labels after data is loaded
// by listening to datapreload event
diagram.addListener( 'wcps','datapreload',
    function(response){
        var values = [];
        for(var i = 0; i < response.data.length; i++){
            values.push( [i, parseInt(response.data[i], 10)]);
        }
        // Configure widget labels
        this.configure({
            axes : {
                xaxis: { title : response.domainInfo.axisLabel },
                yaxis : { title : "Values" }
            }
        });
        return { data : values };
    }
);
diagram.loadData(true);
HTML Code:
<div id='chartPlace' style='width:600px; height:500px;'>
<!-- The chart will go here -->
</div>'
Visual appearance: