11. Cheatsheets
11.1. WCS
The OGC Web Coverage Service (WCS) standard defines support for modeling and retrieval of geospatial data as coverages (e.g. sensor, image, or statistics data).
WCS consists of a Core specification for basic operation support with regards to coverage discovery and retreival, and various Extension specifications for optional capabilities that a service could provide on offered coverage objects.
11.1.1. Core
The Core specification is agnostic of implementation details, hence, access syntax and mechanics are defined by protocol extensions: KVP/GET, XML/POST, and XML/SOAP. Rasdaman supports all three, but further on the examples are in KVP/GET exclusively, as it is the most straightforward way for constructing requests by appending a standard query string to the service endpoint URL. Commonly, for all operations the KVP/GET request will look as follows:
http(s)://<endpoint url>?service=WCS
                        &version=2.0.1
                        &request=<operation>
                        &...
Three fundamental operations are defined by the Core:
GetCapabilities - returns overal service information and a list of available coverages; the request looks generally as above, with the <operation> being GetCapabilities:
http(s)://<endpoint url>?service=WCS&version=2.0.1&request=GetCapabilities
Example:
DescribeCoverage - detailed description of a specific coverage:
http(s)://<endpoint url>?service=WCS&version=2.0.1&request=DescribeCoverage
                        &coverageId=<coverage id>
Example:
GetCoverage - retreive a whole coverage, or arbitrarily restricted on any of its axes whether by new lower/upper bounds (trimming) or at a single index (slicing):
http(s)://<endpoint url>?service=WCS&version=2.0.1&request=GetCoverage
                        &coverageId=<coverage id>
        [optional]      &subset=<axis>(<lower>,<upper>)
        [optional]      &subset=<axis>(<index>)
        [optional]      &format=<mime type>
Example:
11.1.2. Updating
The Transaction extension (WCS-T) specifies the following operations for constructing, maintenance, and removal of coverages on a server: InsertCoverage, UpdateCoverage, and DeleteCoverage.
Rasdaman provides the wcst_import tool to simplify the import of data into analysis-ready coverages (aka datacubes) by generating WCS-T requests as instructed by a simple configuration file.
11.1.3. Processing
The Processing extension enables advanced analytics on coverages through WCPS queries. The request format is as follows:
http(s)://<endpoint url>?service=WCS&version=2.0.1&request=ProcessCoverages
                        &query=<wcps query>
E.g, calculate the average on the subset from the previous GetCoverage example:
11.1.4. Range subsetting
The cell values of some coverages consist of multiple components (also known as ranges, bands, channels, fields, attributes). The Range subsetting extension specifies the extraction and/or recombination in possibly different order of one or more bands. This is done by listing the wanted bands or band intervals; e.g AverageChlorophyllScaled has Blue, Green, and Red bands and the following recombines them into a Red, Green, Blue order:
11.1.5. Scaling
Scaling up or down is a common operation supported by the Scaling extension. An additional GetCoverage parameter indicates the scale factor in several possible ways: as a single number applying to all axes, multiple numbers applying to individual axes, full target scale domain, or per-axis target scale domains. E.g. a single factor to downscale all axes by 4x:
11.1.6. Reprojection
The CRS extension allows to
reproject a coverage before retreiving it. For example AverageChlorophyllScaled
has native CRS EPSG:4326, and the following request will return the result in
EPSG:3857:
or change the CRS in which subset or scale coordinates are specified:
11.1.7. Interpolation
Scaling or reprojection can be performed with various interpolation methods as enabled by the Interpolation extension:
Rasdaman supports several interpolations as documented here.
11.2. WCPS
The OGC Web Coverage Processing Service (WCPS) standard defines a protocol-independent declarative query language for the extraction, processing, and analysis of multi-dimensional coverages representing sensor, image, or statistics data.
The overall execution model of WCPS queries is similar to XQuery FLOWR:
for $covIter1 in (covName, ...),
    $covIter2 in (covName, ...),
    ...
let $aliasVar1 := covExpr,
    $aliasVar2 := covExpr,
    ...
where booleanExpr
return processingExpr
Any coverage listed in the WCS GetCapabilities response can be used in place
of covName. Multiple $covIter essentially translate to nested loops.
For each iteration, the return clause is evaluated if the result of the
where clause is true. Coverage iterators and alias variables can be
freely used in where / return expressions.
Conforming WCPS queries can be submitted to rasdaman as WCS ProcessCoverages requests, e.g:
http://localhost:8080/rasdaman/ows?service=WCS&version=2.0.1
    &request=ProcessCoverages
    &query=for $covIter in (covName) ...
The WSClient deployed with every rasdaman installation provides a convenient console for interactively writing and executing WCPS queries: open http://localhost:8080/rasdaman/ows in your Web browser and proceed to the ProcessCoverages tab.
Operations can be categorized by the type of data they result in: scalar, coverage, or metadata.
11.2.1. Scalar operations
Standard operations applied on scalar operands return scalar results:
Operation category
Operations
Arithmetic
+ - * / abs roundExponential
exp log ln pow sqrtTrigonometric
sin cos tan sinh cosh tanharcsin arccos arctanComparison
> < >= <= = !=Logical
and or xor not bit overlaySelect field from multiband value
.Create multiband value
{ bandName: value; ..., bandName:
value }
Type casting
(baseType) valuewhere baseType is one of: boolean,[unsigned] char / short / int / long,float, double, complex, complex2Aggregation operations summarize coverages into a scalar value.
Aggregation type
Function / Expression
Of numeric coverages
avg,add,min,maxOf boolean coverages
countnumber of true values;some/all= true if some/all values are trueGeneral condenser
condenseopover$iterVar axis(lo:hi), …[whereboolScalarExpr ]usingscalarExprThe general condenser aggregates values across an iteration domain with a condenser operation op (one of
+,*,max,min,and, oror). For each coordinate in the iteration domain defined by theoverclause, the scalar expression in theusingclause is evaluated and added to the final aggregated result; the optionalwhereclause allows to filter values from the aggregation.
11.2.2. Coverage operations
Standard operations applied on coverage (or mixed coverage and scalar) operands return coverage results. The operation is applied pair-wise on each cell from the coverage operands, or on the scalars and each cell from the coverage in case some of the operands are scalars. All coverage operands must have matching domains and CRS.
Subsetting allows to select a part of a coverage (or crop it to a smaller domain):
covExpr[ axis1(lo:hi), axis2(slice), axis3:crs(...), ... ]
axis1in the result is reduced to span from coordinatelotohi. Either or bothloandhican be indicated as*, corresponding to the minimum or maximum bound of that axis.axis2is restricted to the exact slice coordinate and removed from the result.axis3is subsetted in coordinates specified in the givencrs. By default coordinates must be given in the native CRS ofC.
Extend is similar to subsetting but can be used to enlarge a coverage with null values as well, i.e. lo and hi can extend beyond the min/max bounds of a particular axis; only trimming is possible:
extend( covExpr, { axis1(lo:hi), axis2:crs(lo:hi), ... } )Scale is like extend but it resamples the current coverage values to fit the new domain:
scale( covExpr, { axis1(lo:hi), axis2:crs(lo:hi), ... } )Reproject allows to project a 2D coverage with geo X/Y axes by a CRS:
crsTransform( covExpr, { axisX:outputCRS, axisY:outputCRS }, { interpolation } )
or shorthand version
crsTransform( covExpr, “outputCRS”, { interpolation } )
Conditional evaluation is possible with the
switchstatement:switch case boolCovExpr return covExpr case boolCovExpr return covExpr ... default return covExpr
General coverage constructor allows to create a coverage given a domain, where for each coordinate in the domain the value is dynamically calculated from a value expression which potentially references the iterator variables:
coverage covName
over $iterVar axis(lo:hi), ...
values scalarExpr
General condenser on coverages is same as the scalar general condenser, except that in the
usingclause we have a coverage expression. The coverage values produced in each iteration are cell-wise aggregated into a single result coverage.condense op over $iterVar axis(lo:hi), ... [ where boolScalarExpr ] values covExpr
Encode allows to export coverages in a specified data format, e.g:
 encode(covExpr, "image/jpeg")

WCPS supports ``application/gml+xml`` format corresponding to OGC WCS ``GetCoverage`` request.
Many further formats are supported, see :ref:`here <rasql-encode-function-data-format>` for details.
11.2.3. Atomic types
The set of atomic types for Coverage range field data types according to OGC WCPS standard. See rasdaman atomic types for comparison.
type name |
size |
description |
|---|---|---|
|
1 bit |
true (nonzero value), false (zero value) |
|
8 bit |
signed integer |
|
8 bit |
unsigned integer |
|
16 bit |
signed integer |
|
16 bit |
unsigned integer |
|
32 bit |
signed integer |
|
32 bit |
unsigned integer |
|
32 bit |
single precision floating point |
|
64 bit |
double precision floating point |
|
32 bit |
complex of 16 bit signed integers |
|
64 bit |
complex of 32 bit signed integers |
|
64 bit |
single precision floating point complex |
|
128 bit |
double precision floating point complex |
11.2.4. Metadata operations
Several functions allow to extract metadata information about a coverage C:
Metadata function |
Result |
|---|---|
imageCrsDomain(C, a) |
Grid (lo, hi) bounds for axis a |
imageCrsDomain(C, a).x |
Where x is one of |
domain(C, a, c) |
Geo (lo, hi) bounds for axis a in CRS c returning the lower and upper bounds respectively |
domain(C, a, c).x |
Where x is one of |
domain(C, a) |
Geo (lo, hi) bounds for axis a returning the lower and upper bounds respectively |
domain(C, a).x |
Where x is one of |
domain(C) |
List of comma-separated axes and their bounds according to coverage’s CRS orders respectively. Each list element contains an axis a with the lower and upper bounds in the axis CRS |
crsSet(C) |
Set of CRS identifiers |
imageCrs(C) |
Return the grid CRS (CRS:1) |
nullSet(C) |
Set of null values |
11.3. WMS
The OGC Web Map Service (WMS) standard defines map portrayal on geo-spatial data. In rasdaman, a WMS service can be enabled on any coverage, including 3-D or higher dimensional; the latest 1.3.0 version is supported.
rasdaman supports two operations: GetCapabilities, GetMap from the standard. We will not go into the details, as users do not normally hand-write WMS requests, but let a client tool or library generate them instead. Please check the Clients section for some examples.
11.4. Clients
11.4.1. Rasdaman WSClient
WSClient is a web-client application to interact with WCS (version 2.0.1)
and WMS (version 1.3.0) compliant servers. Once rasdaman is installed it is
usually accessible at http://localhost:8080/rasdaman/ows; a publicly
accessible example is available at http://ows.rasdaman.org/rasdaman/ows. The
client has three main tabs: OGC Web Coverage Service (WCS), OGC Web Map
Service (WMS) and Admin. Further on, the functionality in each tab is
described in details.
11.4.1.1. WCS
There are sub-tabs for each of OGC WCS standard requests: GetCapabilities, DescribeCoverage, GetCoverage, ProcessCoverages.
GetCapabilities
This is the default tab when accessing the WSClient. It lists all coverages
available at the specified WCS endpoint. Clicking on the Get Capabilities
button will reload the coverages list. One can also search a coverage by typing
the first characters of its name in the text box. Clicking on a coverage name
will move to DescribeCoverage tab to view its metadata.
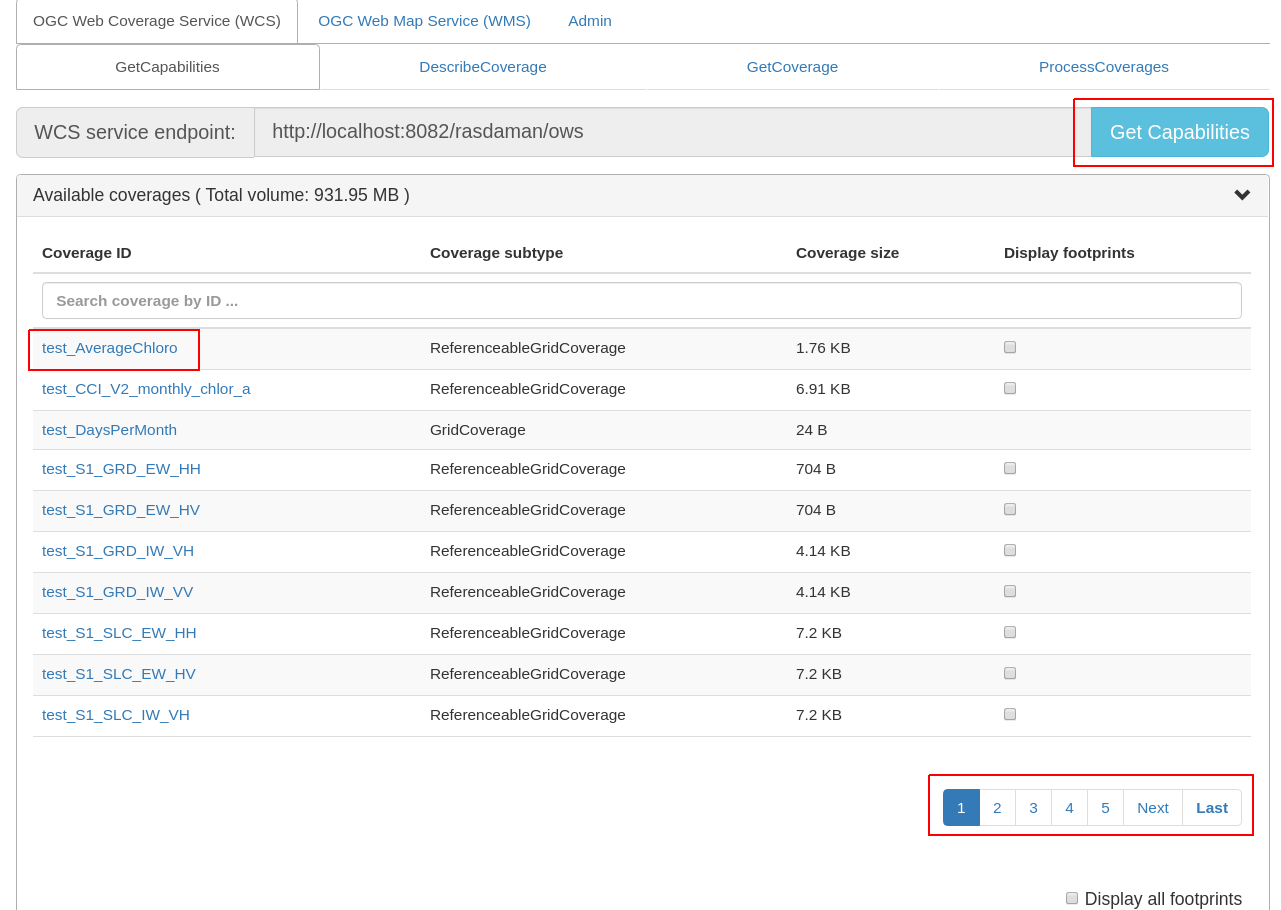
Figure 11.1 List of coverages shown on the GetCapabilities tab.
If a coverage is geo-referenced, a checkbox will be visible in the Display
footprints column, allowing to view the coverage’s geo bounding box (in
EPSG:4326) on the globe below.
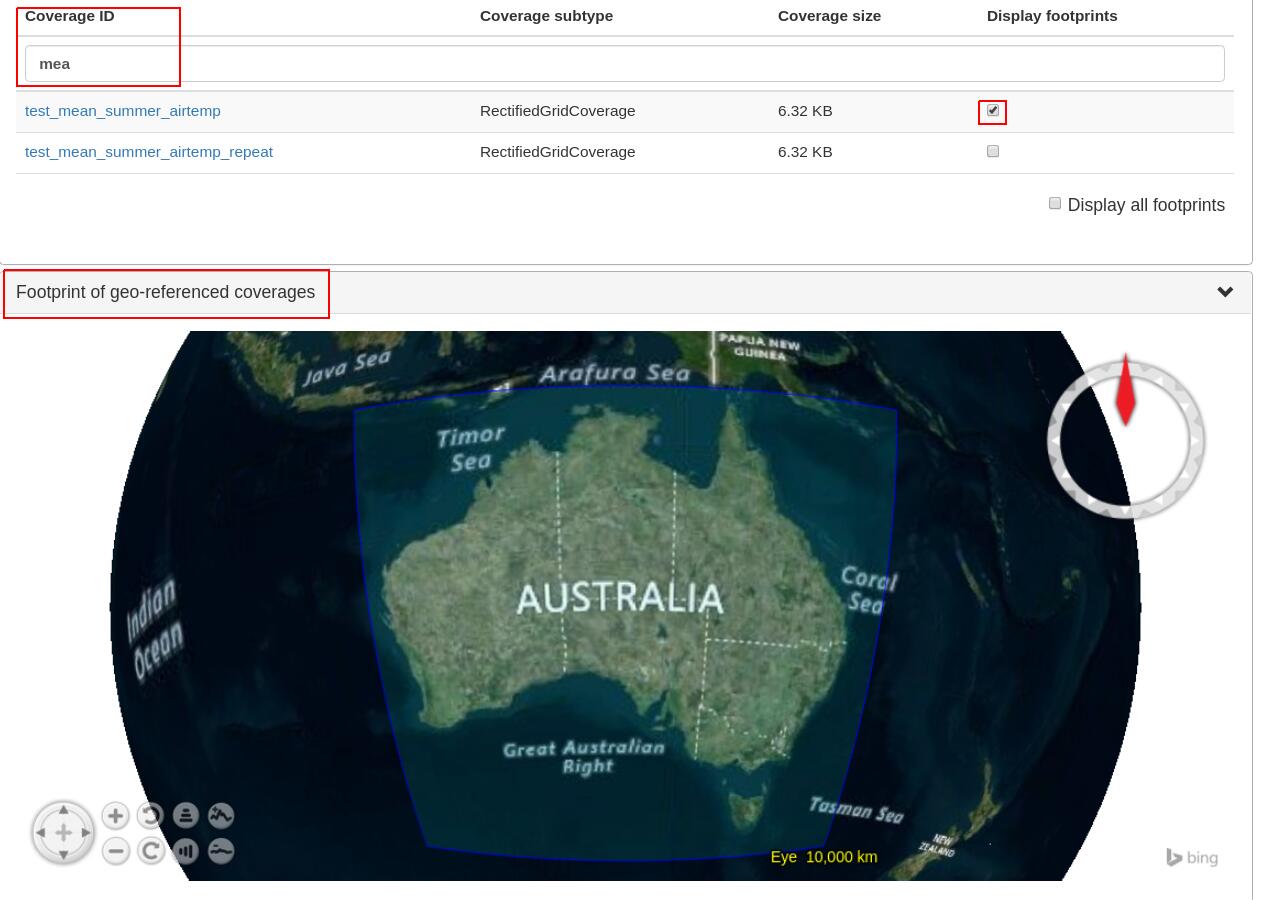
Figure 11.2 Selected coverage footprints shown on a globe.
At the bottom the metadata of the OGC WCS service endpoint are shown. These
metadata can be changed in the Admin -> OWS Metadata Management tab. Once
updated in the admin tab, click on Get Capabilities button to see the new
metadata.
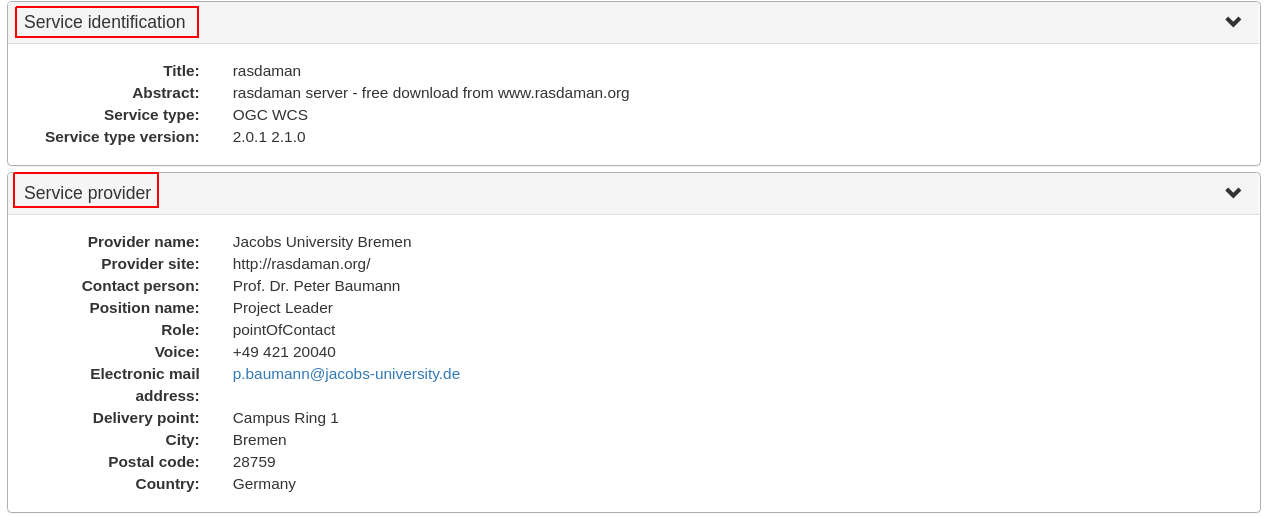
Figure 11.3 WCS service metadata.
DescribeCoverage
Here the full description of a selected coverage can be seen. One can type the
first few characters to search for a coverage id and click on Describe
Coverage button to view its OGC WCS metadata.
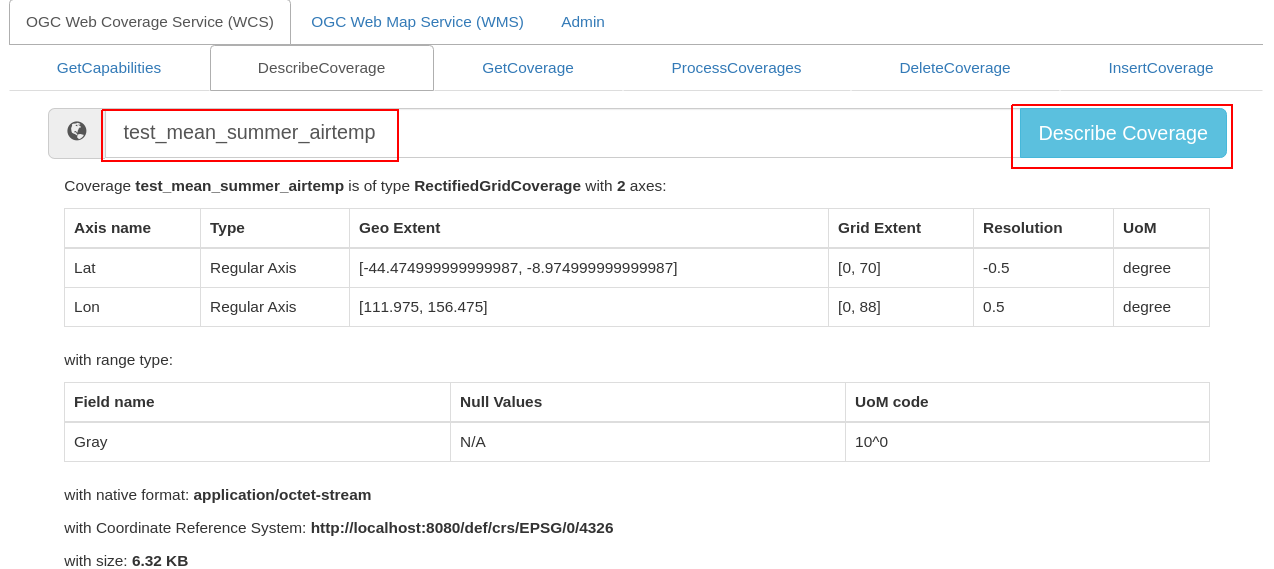
Figure 11.4 Showing full description of a coverage.
Once logged in as admin, it’s possible to replace the metadata with one from a valid XML or JSON file.
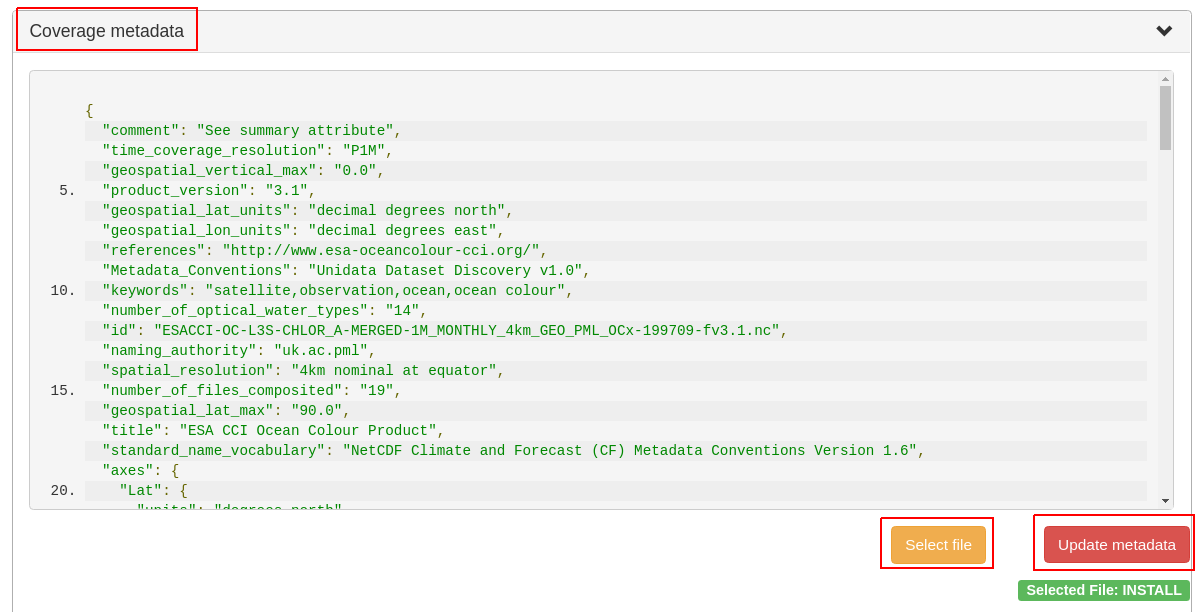
Figure 11.5 Updating the metadata of a coverage.
GetCoverage
Downloading coverage data can be done on this tab (or the next one,
ProcessCoverages). It’s similiarly possible search for a coverage id in the text
box and click on Select Coverage button to view its boundaries. Depending on
the coverage dimension, one can do trim or slice subsets on the corresponding
axes to select an area of interest. The output format can be selected (provided
it supports the output dimension). Finally, clicking on Get Coverage button
will download the coverage.
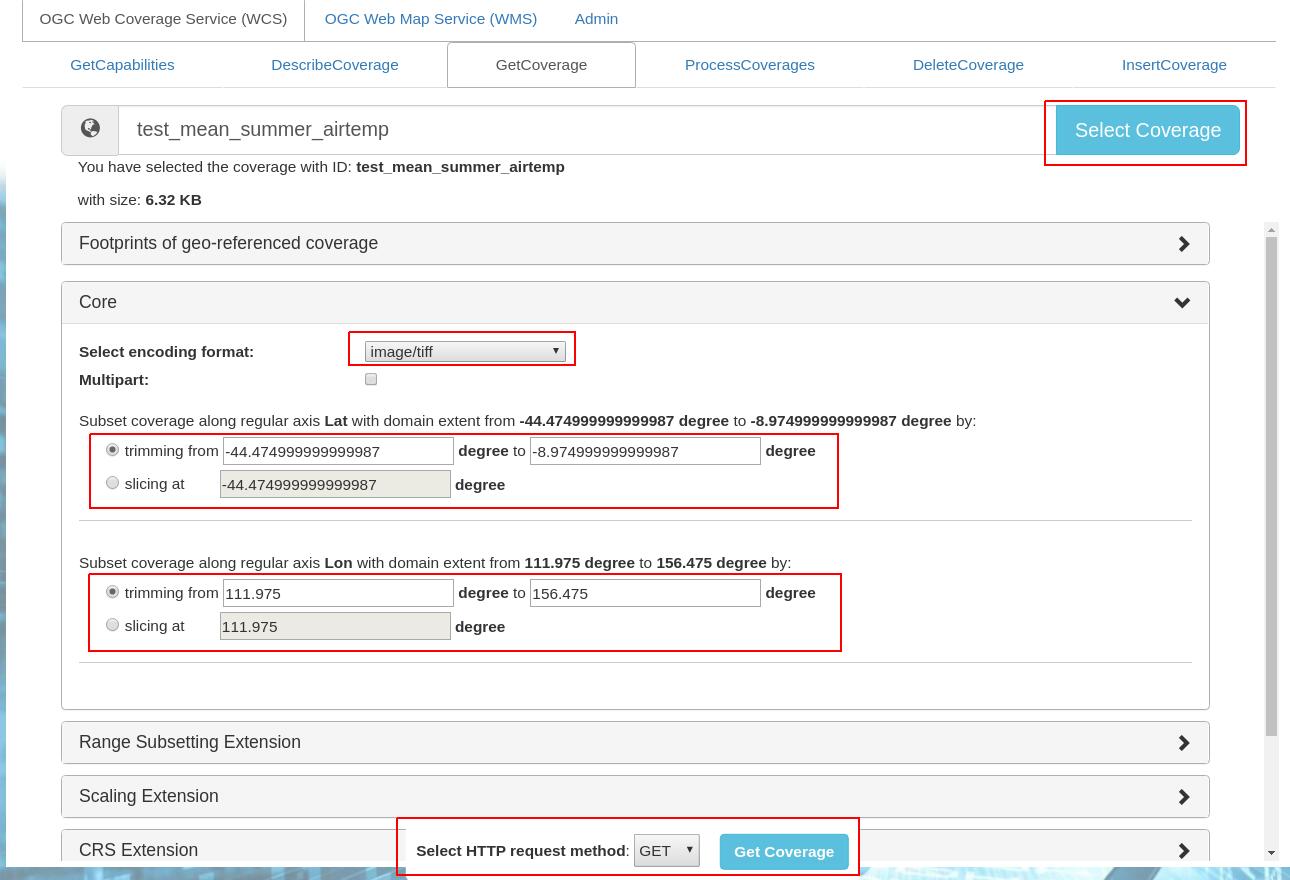
Figure 11.6 Downloading a subset of a coverage, encoded in image/tiff.
In addition, further parameters can be specified as supported by the WCS extensions, e.g. scaling factor, output CRS, subset of ranges (bands), etc.
ProcessCoverages
WCPS queries can be typed in a text box. Once Excute is clicked, the result
will be
displayed on the output console if it’s a scalar or the query was prefixed with
image>>(for 2D png/jpeg) ordiagram>>for (1D csv/json);otherwise it will be downloaded.
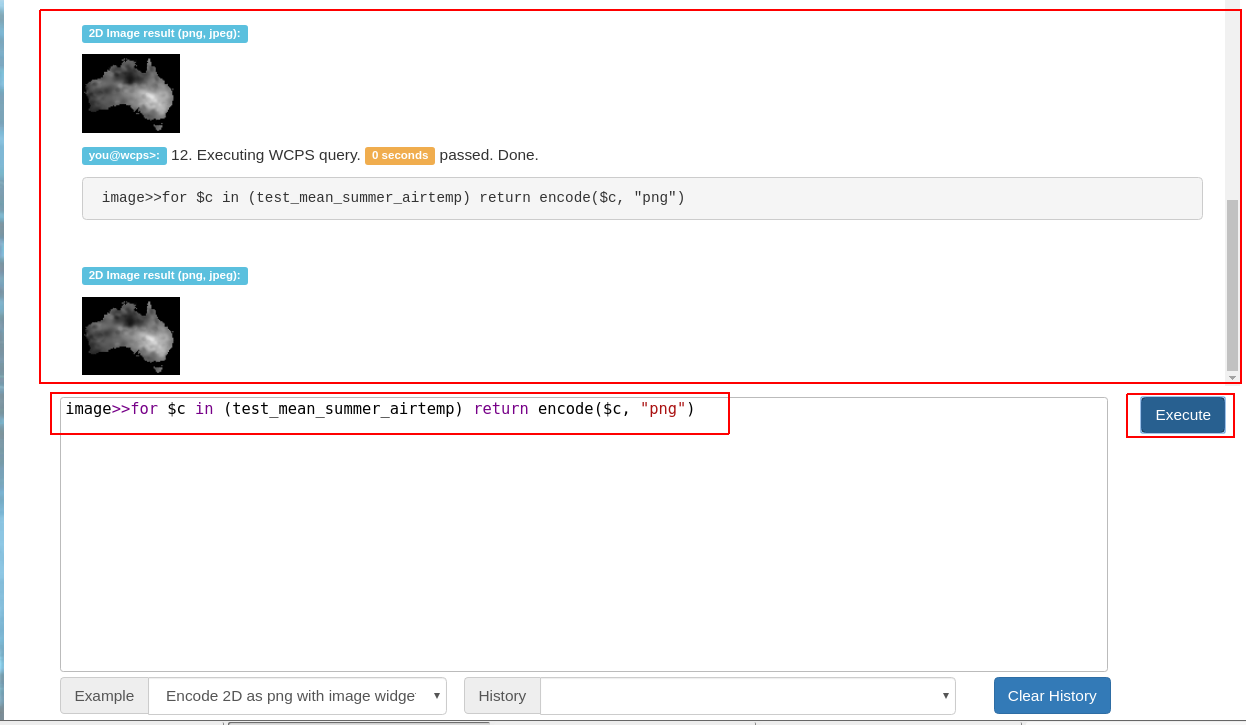
Figure 11.7 Query and output areas on the ProcessCoverages tab.
DeleteCoverage
This tab allows to delete a specific coverage from the server. It is only
visible when logged in the Admin tab.
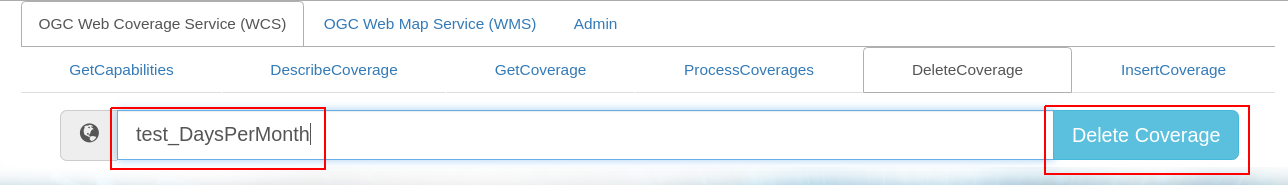
Figure 11.8 Deleting coverage test_DaysPerMonth.
InsertCoverage
Similarly, this tab is only visible when logged in the Admin tab. To insert
a coverage, a URL pointing to a valid coverage definition according to the WCS-T
standard needs to be provided. Clicking on Insert Coverage button will
invoke the correct WCS-T request on the server.
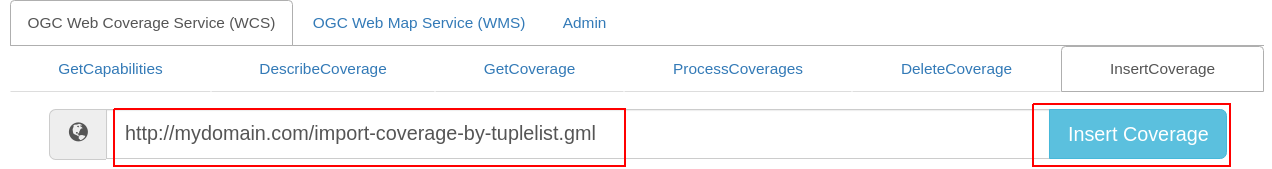
Figure 11.9 Inserting a coverage given a URL pointing to a valid GML document.
11.4.1.2. WMS
This tab contain sub-tabs which are related to the supported OGC WMS requests.
GetCapabilities
This tab lists the available layers on the specified server. To reload the list,
click on the Get Capabilities button. Clicking on a layer name will move to
DescribeLayer tab to view its description.
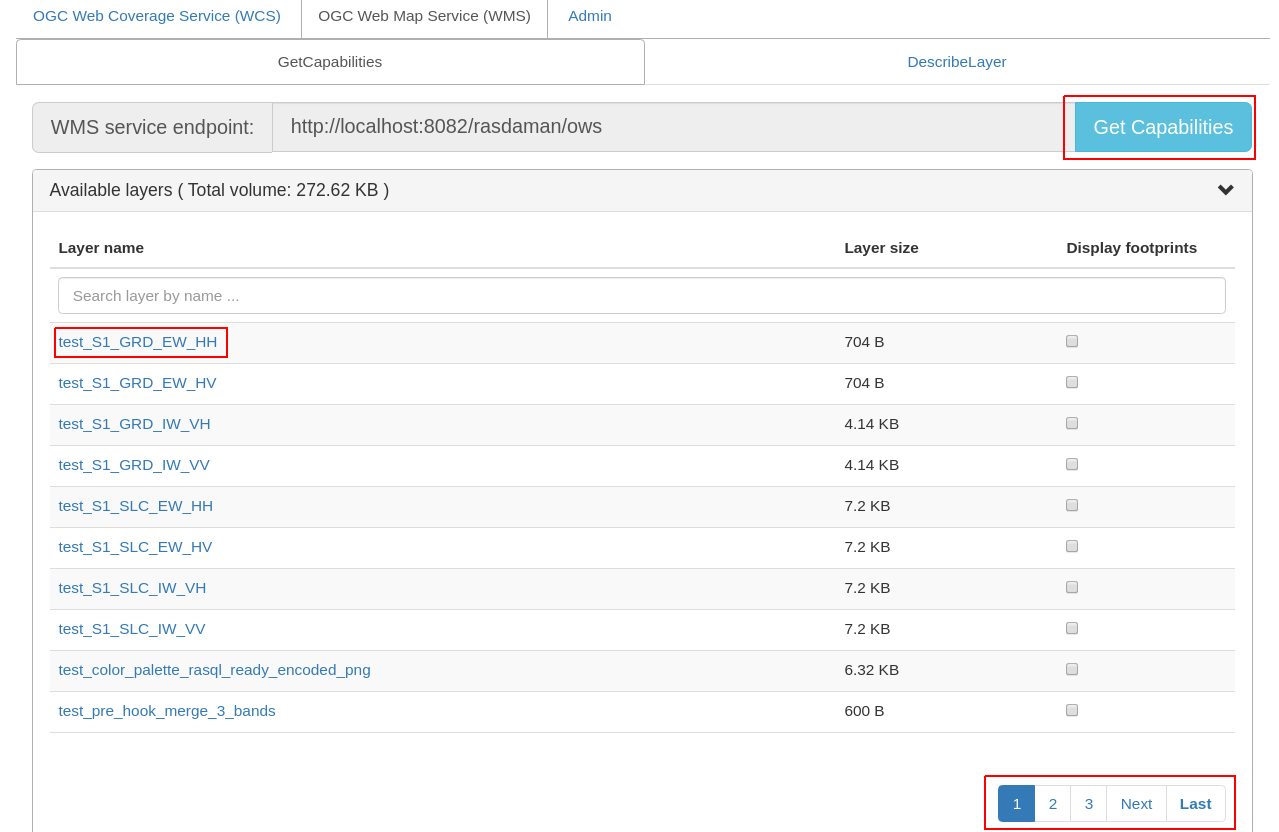
Figure 11.10 List of layers shown on the GetCapabilities tab.
Similar to the WCS GetCapabilities tab, it’s possible to search for layer names, or show their footprints.
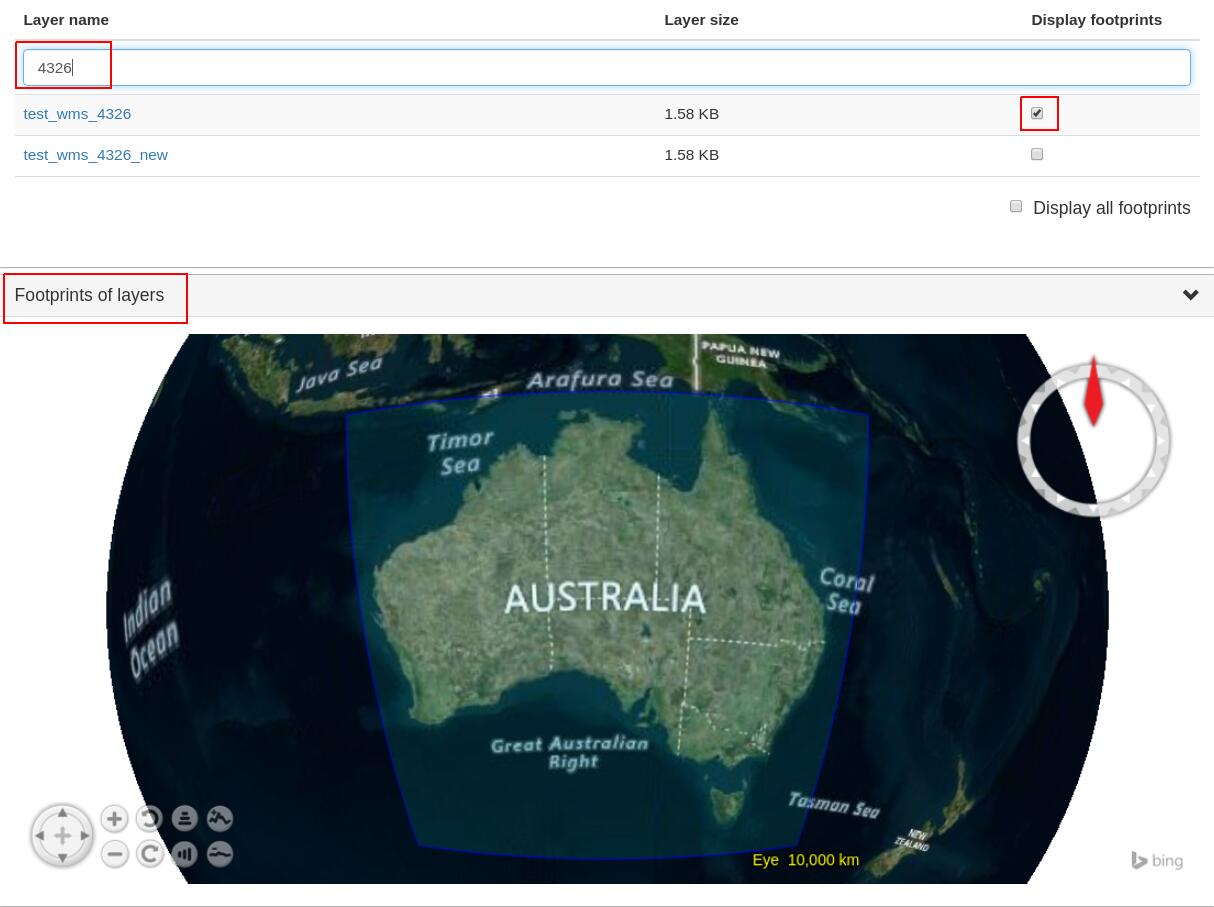
Figure 11.11 Selected layer footprints shown on a globe.
DescribeLayer
Here the full description of a selected layer is shown. One can type the first
few characters to search for a layer name and click on Describe Layer button
to view its OGC WMS metadata.
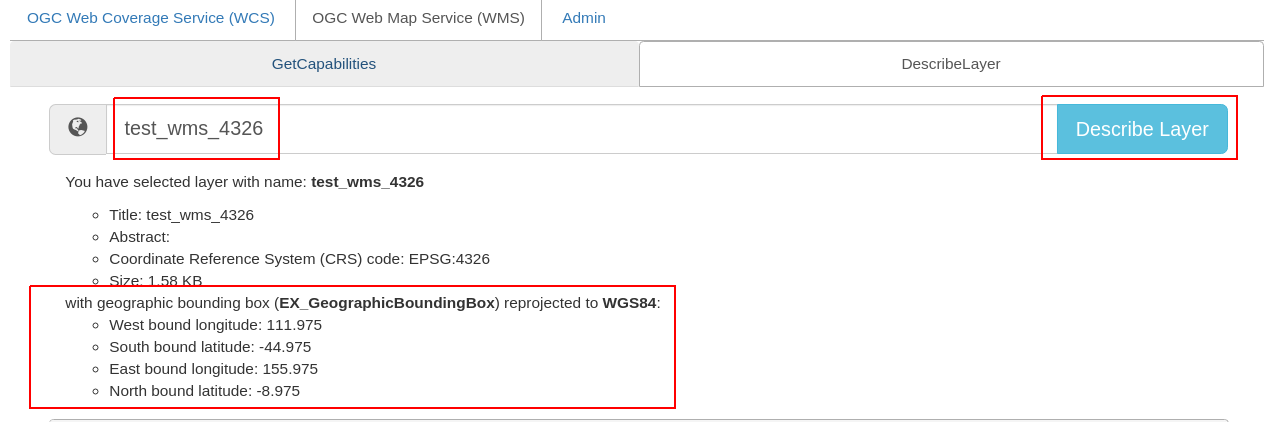
Figure 11.12 Showing full description of a layer.
Depending on layer’s dimension, one can click on show layer button and
interact with axes’ sliders to view a layer’s slice on the globe below. Click on
the hide layer button to hide the displayed layer on the globe.
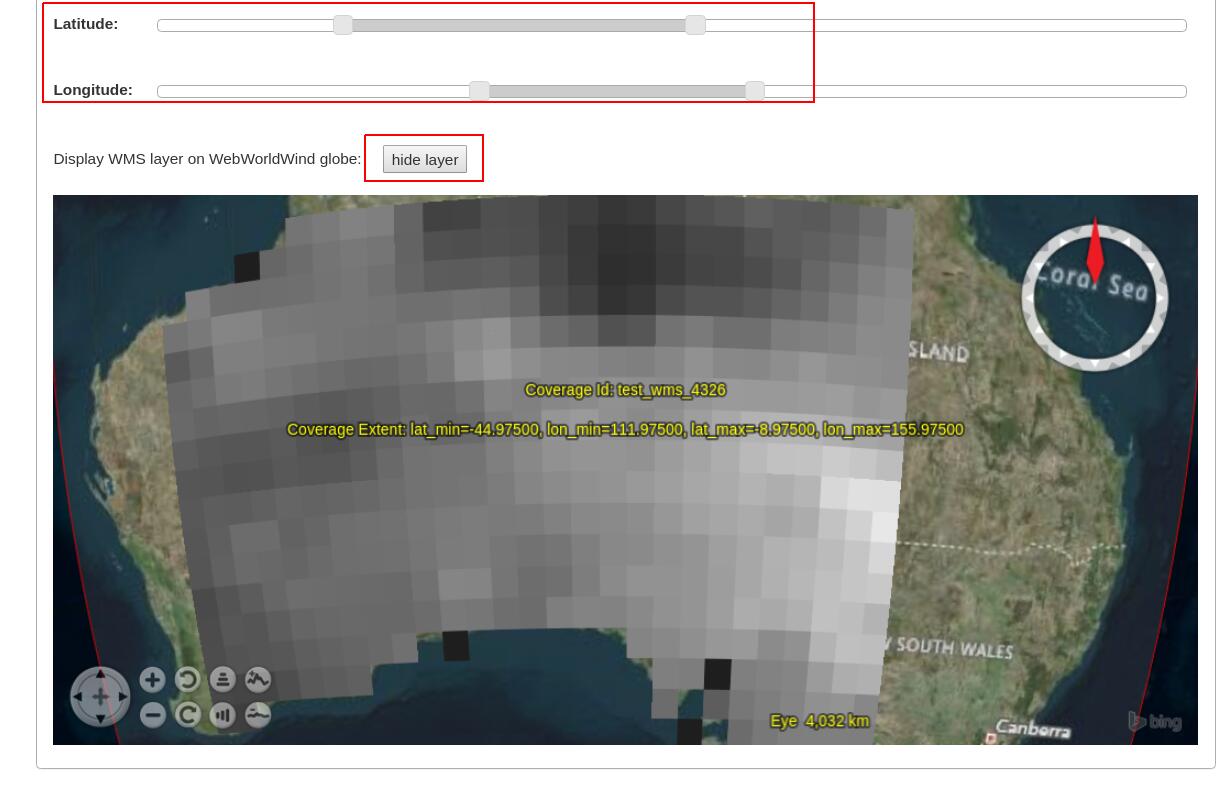
Figure 11.13 Showing/hiding a layer on the map.
Once logged in as admin, managing WMS styles is possible on this tab.
To create a style, it is required to input various parameters along with
a rasql or WCPS query fragment, which are applied on every GetMap request
if the style is active. Afterwards, click on Insert Style to insert
a new style or Update Style to update an existing style of the current
selected layer. One can also delete an existing style by clicking on
the Delete button corresponding to a style name.
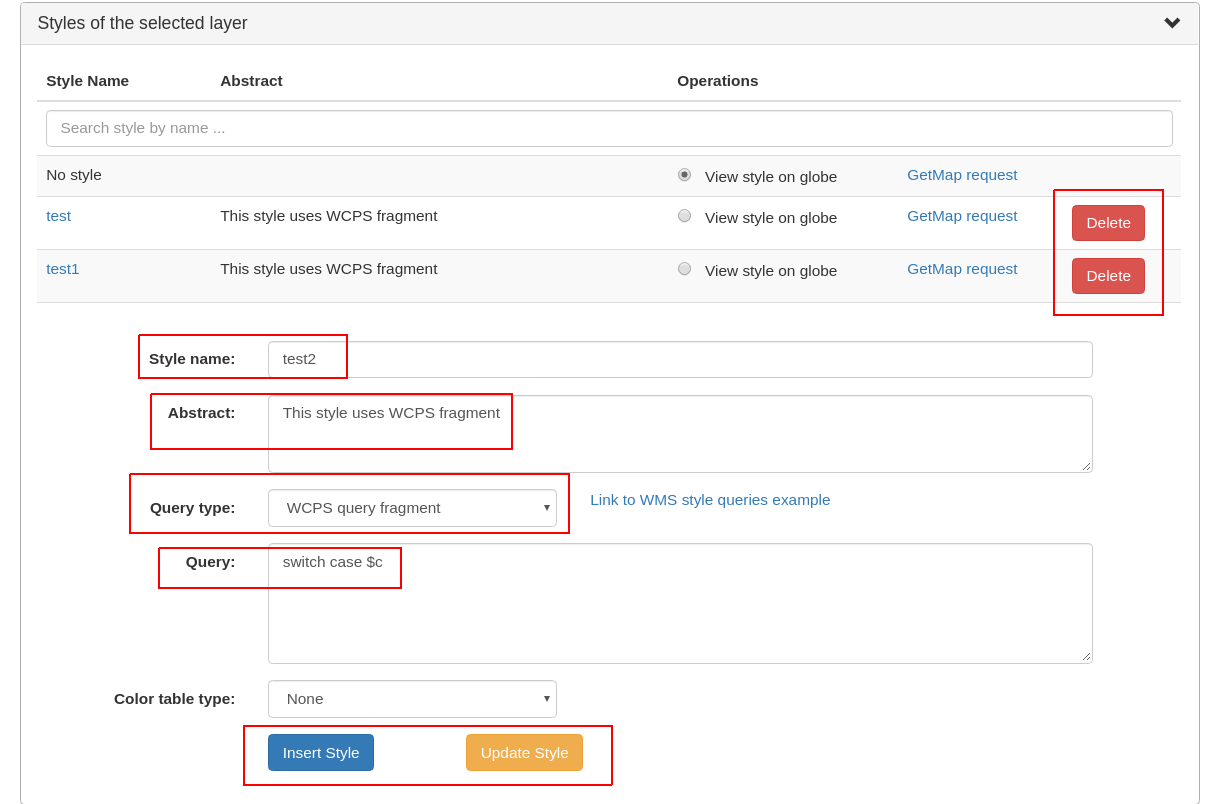
Figure 11.14 Style management on the DescribeLayer tab.
Finally, once logged in as admin, managing downscaled collection levels
of a WMS layer is also possible on this tab. To create a new level,
it is required to input level parameter (positive number). Afterwards,
click on Insert Level to insert a new downscaled collection level
of the current selected layer. One can also delete an existing level
by clicking on the Delete button corresponding to a downscaled
collection level.
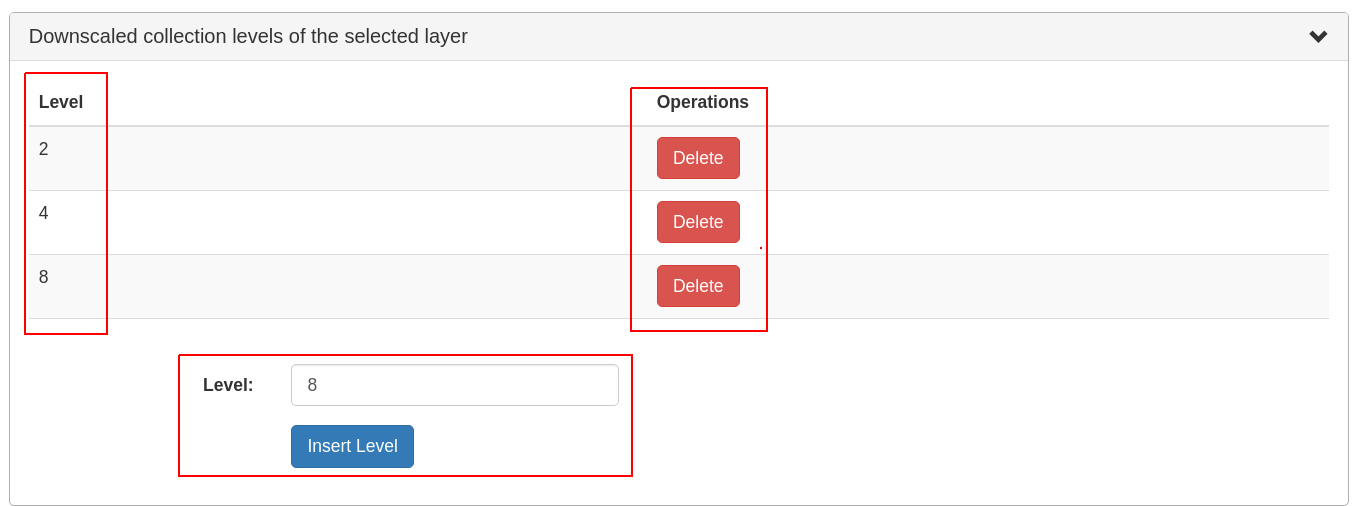
Figure 11.15 Downscaled collection level management on the DescribeLayer tab.
11.4.2. NASA WebWorldWind
Simple example to setup a web page with a map from a WMS server using WebWorldWind:
<html>
  <head>
    <script src="https://files.worldwind.arc.nasa.gov/artifactory/web/0.9.0/worldwind.min.js"></script>
    <script>
      document.addEventListener("DOMContentLoaded", function(event) {
        WorldWind.Logger.setLoggingLevel(WorldWind.Logger.LEVEL_WARNING);
        var wwd = new WorldWind.WorldWindow("canvasOne");
        var layers = [{
          layer: new WorldWind.BingRoadsLayer(null),
          enabled: true
        }, {
          layer: new WorldWind.CoordinatesDisplayLayer(wwd),
          enabled: true
        }, {
          layer: new WorldWind.ViewControlsLayer(wwd),
          enabled: true
        }];

        for (var l = 0; l < layers.length; l++) {
          wwd.addLayer(layers[l].layer);
        }

        var layerNamesToRequest = ["AvgTemperatureColorScaled"];
        var config = {
          title: "AvgTemperatureColorScaled", version: "1.3.0",
          service: "http://ows.rasdaman.org/rasdaman/ows",
          layerNames: layerNamesToRequest,
          // min Lat, max Lat, min Long, max Long of the requesting layer
          sector: new WorldWind.Sector(-90, 90, -180, 180),
          levelZeroDelta: new WorldWind.Location(36, 36),
          numLevels: 15, format: "image/png", styleNames: "", size: 256
        };

        var wmsLayer = new WorldWind.WmsLayer(config);
        wmsLayer.enabled = true;
        wwd.addLayer(wmsLayer);
      });
    </script>
  </head>
  <body>
      <canvas id="canvasOne" style="width: 100%; height: 100%;"> </canvas>
  </body>
</html>
11.4.3. Python / Jupter Notebook
11.4.3.1. OWSLib
OWSLib is a Python package that helps with programming clients for OGC services such as WCS, WCPS, or WMS. To install it please follow the official installation instructions. Example usage for WCS follows below.
>>> # Import OWSLib in Python once installed
... from owslib.wcs import WebCoverageService

>>> # Create coverage object
... my_wcs = WebCoverageService('http://ows.rasdaman.org/rasdaman/ows',
...                             version='2.0.1')

>>> # Get list of coverages
... print my_wcs.contents.keys()
['RadianceColor', 'test_irr_cube_2', 'test_mean_summer_airtemp',
 'test_double_1d', 'INSPIRE_EL', 'AverageChlorophyllScaled', 'INSPIRE_OI_RGB',
 'Temperature4D', 'INSPIRE_OI_IR', 'visible_human', 'INSPIRE_WS_LC',
 'meris_lai', 'climate_earth', 'mean_summer_airtemp', 'multiband',
 'ls8_coastal_aerosol', 'NN3_3', 'NN3_2', 'NN3_1', 'NN3_4',
 'AvgTemperatureColorScaled', 'AverageChloroColorScaled', 'lena',
 'Germany_DTM', 'climate_cloud', 'FiLCCoverageBit', 'AverageChloroColor',
 'LandsatMultiBand', 'RadianceColorScaled', 'AvgLandTemp', 'NIR', 'BlueMarbleCov']

>>> # Get geo-bounding boxes and native CRS
... my_wcs.contents['AverageChlorophyllScaled'].boundingboxes
[{'nativeSrs': 'http://ows.rasdaman.org/def/crs-compound?
  1=http://ows.rasdaman.org/def/crs/EPSG/0/4326&
  2=http://ows.rasdaman.org/def/crs/OGC/0/UnixTime',
  'bbox': (-90.0, -180.0, 90.0, 180.0)}]

>>> # Get axis labels
... my_wcs.contents['AverageChlorophyllScaled'].grid.axislabels
['Lat', 'Long', 'unix']

>>> # Get dimension
... my_wcs.contents['AverageChlorophyllScaled'].grid.dimension
3

>>> # Get grid lower and upper bounds
... my_wcs.contents['AverageChlorophyllScaled'].grid.lowlimits
['0', '0', '0']

>>> my_wcs.contents['AverageChlorophyllScaled'].grid.highlimits
['119', '239', '5']

>>> # Get offset vectors for geo axes
... my_wcs.contents['AverageChlorophyllScaled'].grid.offsetvectors
[['-1.5', '0', '0'], ['0', '1.5', '0'], ['0', '0', '1']]

>>> # For coverage with time axis get the date time values
... my_wcs.contents['AverageChlorophyllScaled'].timepositions
[datetime.datetime(2015, 1, 1, 0, 0), datetime.datetime(2015, 2, 1, 0, 0),
 datetime.datetime(2015, 3, 1, 0, 0), datetime.datetime(2015, 4, 1, 0, 0),
 datetime.datetime(2015, 5, 1, 0, 0), datetime.datetime(2015, 7, 1, 0, 0)]
11.4.3.2. rasdapy3
rasdapy3 is a client API for rasdaman that enables building and executing rasql queries within python. Best practice code snippets are also provided.
11.4.3.3. wcps_rasdaman.py
wcps_rasdaman.py is a python client which sends a WCPS query to a rasdaman server and wraps the response for further use depending on the response format chosen in the query.
11.4.4. Access from R
Accessing rasdaman from R is possible in two ways right now:
RRasdaman enables connecting to rasdaman, executing rasql queries, and retreiving results.
CubeR allows convenient executiong of WCPS queries directly from R. Check also this accompanying presentation.
11.4.5. OpenLayers
Simple example to setup a web page with a map from a WMS server using OpenLayers:
<html>
  <head>
     <link rel="stylesheet" href="https://cdnjs.cloudflare.com/ajax/libs/openlayers/3.8.2/ol.css"></link>
     <script src="https://cdnjs.cloudflare.com/ajax/libs/openlayers/3.8.2/ol.js"></script>
     <script>
      document.addEventListener("DOMContentLoaded", function(event) {
        var layers = [
          new ol.layer.Tile({
            source: new ol.source.TileWMS({
              url: "https://ahocevar.com/geoserver/wms",
              params: {'LAYERS': 'ne:NE1_HR_LC_SR_W_DR'}
            })
          }),
          new ol.layer.Tile({
            source: new ol.source.TileWMS({
              url: "http://ows.rasdaman.org/rasdaman/ows",
              params: {'LAYERS': 'AvgTemperatureColorScaled'}
            })
          })
        ];
        var map = new ol.Map({
          layers: layers,
          target: 'map',
          view: new ol.View({
            center: [7.5, 53.15178], projection : "EPSG:4326", zoom: 6
          })
        });
      });
     </script>
  </head>
  <body>
    <div id="map" style="width: 100%; height: 95vh"> </div>
  </body>
</html>
11.4.6. Leaflet
Simple example to setup a web page with a map from a WMS server using Leaflet:
<html>
  <head>
    <link rel="stylesheet" href="https://unpkg.com/leaflet@1.6.0/dist/leaflet.css"/>
    <script src="https://unpkg.com/leaflet@1.6.0/dist/leaflet.js"></script>
    <script>
      document.addEventListener("DOMContentLoaded", function(event) {
        var map = new L.Map('map', {
          center: new L.LatLng(40, 52),
          zoom: 3, attributionControl: true, zoomControl: true, minZoom: 2
        });
        var wmsLayer = L.tileLayer.wms("http://ows.rasdaman.org/rasdaman/ows", {
          version: '1.3.0', layers: 'AvgTemperatureColorScaled', format: 'image/png'
        });
        map.addLayer(wmsLayer);
      });
    </script>
  </head>
  <body>
    <div id="map" style="width: 100%; height: 100%;"> </div>
  </body>
</html>
11.4.8. Command-line tools
It’s straightforward to make individual OGC WCS / WCPS / WMS requests from the
terminal. Examples with curl follow.
Make a GetCapabilities request:
curl "http://ows.rasdaman.org/rasdaman/ows\
?service=WCS&version=2.0.1&request=GetCapabilities"
Execute a WCPS query with a ProcessCoverages request:
curl "http://ows.rasdaman.org/rasdaman/ows" --out test.png --data-urlencode \
'service=WCS&version=2.0.1&request=ProcessCoverages&query=\
for c in (mean_summer_airtemp) return encode(c, "png")'
When the server requires basic authentication for a request, the rasdaman
user credentials can be specified with the --user option, e.g.
curl --user "rasadmin:rasadmin" \
     "http://localhost:8080/rasdaman/ows?
      service=WCS&version=2.0.1&request=DeleteCoverage&coverageId=test_coverage"
11.4.9. Rasql Web Console
The rasql web console is installed by rasdaman in $RMANHOME/share/rasdaman/www/rasql-web-console.
It requires petascope to be running in the background in order to execute queries.
Various widgets are available, with the most commonly-used being:
imageto visualize a 2D image result, e.g.image>>select encode(..., "jpeg") from ...diagramon csv encoded data, e.g.diagram(type=area,width=300)>>select encode(..., "csv") from ...textto visualize a text result, e.g.text>>select dbinfo(...) from ...
Without using a widget the result is downloaded.
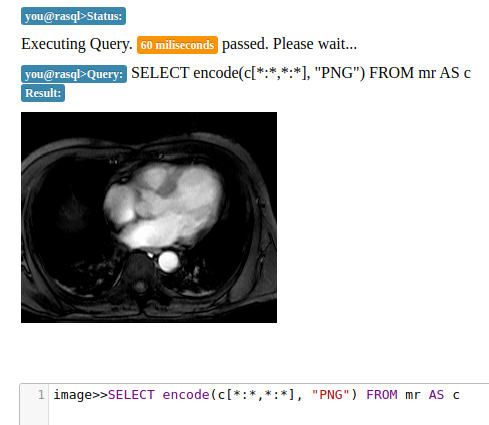
Figure 11.16 Example of a 2D image result.